Before AI can optimize your plant, analytics has to make it legible. Here’s what foundational data analytics looks like in manufacturing — and how to build it right.
This post is part 1 of a 2 part series on data analytics in manufacturing. Part 1 deals with delivering immediate impact while setting up the data analytics foundation to build AI & Advanced and Analytics capabilities in the future. Part 2 looks at AI & Advanced Analytics use cases.
What is Data Analytics in Manufacturing?
Data analytics in manufacturing refers to the process of collecting, organizing, and analyzing operational data to improve visibility, efficiency, and decision-making. This includes data from ERP systems, shop floor equipment, procurement processes, and inventory systems. It transforms these isolated data points into a clear picture of how your business is actually performing.
At its core, manufacturing analytics is about answering fundamental questions:
- What is happening in our operations right now?
- Where are we losing time, money, or materials?
- How can we improve performance using the data we already have?
Unlike complex data science initiatives, foundational analytics focuses on clarity and usability—turning raw data into automated dashboards, reports, and insights that operators and managers can act on immediately.
Data Analytics vs. AI & Advanced Analytics — and Why the Order Matters
These terms are often used interchangeably, but they represent different capabilities and different levels of data maturity. Most manufacturers are better served by building analytics well before pursuing AI — not because AI isn’t valuable, but because AI runs on the same data infrastructure that analytics builds. Skip that foundation and advanced tools will underperform, or produce results nobody trusts. If your underlying data is messy, fragmented or low-quality, even the most advanced AI will produce “garbage in, garbage out” results.
Data Analytics (This Post)
- Descriptive and diagnostic — what happened and why
- Real-time dashboards and KPI reporting
- Automated alerts when thresholds are crossed
- Trend tracking across shifts, lines, and suppliers
- Standardized data collection and definitions
- Rule-based workflow triggers and automation
- Works with structured, digitized operational data
AI & Advanced Analytics (Part 2)
- Predictive and prescriptive — what will happen and what to do
- Machine learning models trained on historical patterns
- Predictive maintenance and anomaly detection
- Demand forecasting with probabilistic outputs
- Computer vision for inline quality inspection
- Digital twins and process simulation
- Requires clean, consistent historical data to function
9 High-Impact Use Cases for Data Analytics in Manufacturing
The following use cases represent where foundational analytics delivers the clearest and most consistent value across manufacturing operations. None require machine learning or AI — they require good data, clear definitions, and the right tools to surface and act on what the data is already telling you.
From our research surveying US SMB Manufacturers across 14 sectors: Data Analytics was cited as the highest priority near-term technology investment area among SMB manufacturers surveyed
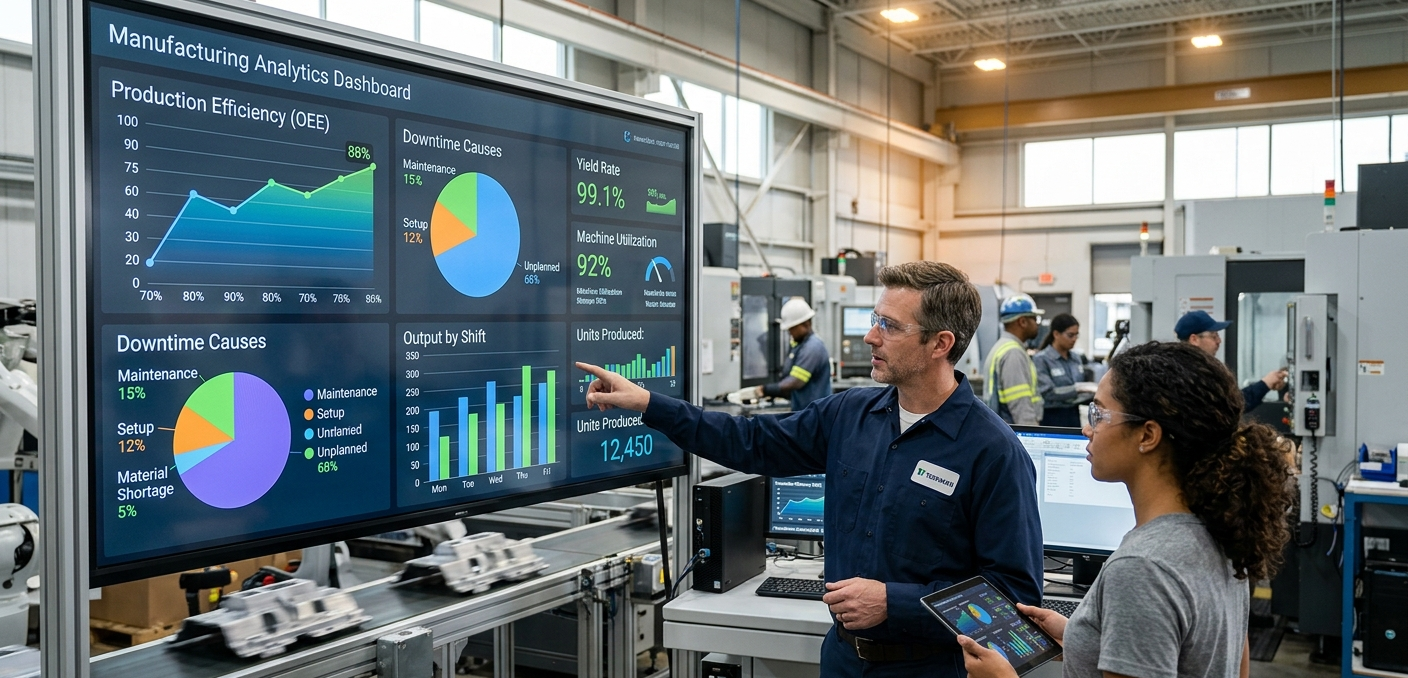
1) Real-time Operational Visibility and Automated Reporting
Most manufacturing operations generate far more data than anyone can act on manually. Real-time dashboards that aggregate data from machines, ERP systems, and operator inputs give supervisors and managers a live view of what’s happening across the floor — without walking lines, making calls, or waiting for end-of-shift summaries.
Automated reporting eliminates the recurring manual work of building daily shift summaries, weekly quality scorecards, and monthly KPI packages. Reports run on schedule, pull fresh data automatically, and reach the right people without anyone touching a spreadsheet. The result: less time building reports, more time responding to what they say.
Performance Benchmarking
Operational data only becomes actionable when you can compare it across time, shifts, lines, and facilities. Benchmarking identifies where performance gaps exist and how large they are — whether that’s a 3-point yield gap between day and night shift, a supplier whose lead times consistently drift, or a work center that’s the clear bottleneck across multiple product lines. Those comparisons are what focus improvement energy where it actually matters.
Alert Triggers
Threshold-based alerts notify the right people the moment a metric moves outside acceptable bounds — a scrap rate crossing 3%, a machine exceeding a downtime target, an order falling behind schedule. Teams respond to conditions in real time rather than discovering them in tomorrow’s report. Done well, alerts reduce the cognitive load on supervisors while ensuring nothing critical gets missed.
Action Triggers
The next step beyond alerts is automation: using data conditions to trigger downstream workflow actions without manual intervention. When a production order hits a defined completion threshold, the next work order releases automatically. When inventory drops below reorder point, a purchase requisition is created. When a quality check fails, the batch is placed on hold and routed for review. Simple rules applied consistently and reliably.
Manufacturers can consolidate data into dashboards that track:
- Production output and throughput
- Order status and delays
- Inventory levels
- Machine and labor performance
2) Throughput Analysis, Workflow Optimization and Bottleneck Identification
Bottleneck Identification: Every production process has a constraint — the step that limits throughput for everything downstream. In most facilities, that bottleneck isn’t formally identified, which means improvement efforts get distributed across the line rather than concentrated at the actual constraint.
Throughput Analysis: Throughput analytics quantifies where work accumulates, where cycle times stretch, and where WIP inventory stacks up waiting for the next operation. With that data, operations teams can make targeted interventions: rebalancing staffing, adjusting batch sizes, redesigning a workstation layout, or sequencing orders differently to keep the constraint fed and productive.
A 5-point OEE improvement on a high-volume line can be worth significant dollars in recaptured capacity — often without any capital investment. Throughput analysis is how you find those 5 points.
Workflow Optimization: Workflow optimization goes beyond the constraint itself. It examines handoffs between operations, changeover sequences, scheduling logic, and material flow to identify where time is lost between value-adding steps. These interstitial losses are often invisible in high-level metrics but add up to significant recoverable capacity.
Data analytics enables teams to:
- Analyze cycle times across production steps
- Identify constraints limiting throughput
- Reduce wait times and work-in-progress buildup
- Optimize flow across the entire production process
The result is faster production, better asset utilization, and reduced operational friction.
3) Quality Control and Defect Analysis and Root Cause Reporting
Quality problems rarely appear without warning — they build over time. A defect rate ticking up slightly across two weeks, a scrap category appearing more frequently on a specific shift, a component generating more rework than it did last quarter. The challenge is catching these trends before they compound into expensive outcomes.
Tracking quality data systematically — by product, line, operator, supplier, shift, and time of day — makes early trend detection routine. Pareto analysis ranks defect types by frequency and cost, ensuring that improvement energy focuses on the handful of issues driving the majority of quality cost.
When a problem does occur, structured quality data transforms root cause investigation. Instead of relying on memory and anecdote, engineers can query actual records: when defects started appearing, what changed upstream, which inputs were different. That structured traceability cuts investigation time and produces more reliable corrective actions.
With structured data, manufacturers can:
- Track defect rates by product, line, or shift
- Identify patterns in scrap and rework
- Correlate defects with materials, machines, or operators
- Generate root cause reports for continuous improvement
This shifts quality from reactive inspection to proactive management.
4) Basic Automation of Manual Tasks
A significant portion of time in most manufacturing operations goes toward tasks that are repetitive, rule-based, and don’t require human judgment: generating reports, copying data between systems, manually triggering purchase orders, logging inspection results, and sending status updates. These tasks are also the most error-prone — manual processes introduce inconsistency, and important steps get missed when people are busy.
Basic automation — connecting data systems so that defined conditions trigger predefined actions — reclaims that time and eliminates the failure modes. Reports that were built by hand now run on schedule. Purchase orders that required manual review now generate automatically when conditions are met. Status notifications that required a phone call now fire from the system.
The goal isn’t to remove people from the process. It’s to remove manual friction from tasks where human judgment adds no value, so that people can focus where their judgment actually matters.
Data analytics tools can automate:
- Daily and weekly reporting
- Data consolidation from multiple systems
- Status updates and notifications
- Exception tracking and escalation
This reduces errors, saves time, and ensures teams are working from consistent, up-to-date information.
5) Process Standardization
One of the underappreciated benefits of building a data foundation is that it forces process standardization. You can’t report consistently on what you haven’t defined consistently. When every shift uses a different method to log downtime, when scrap is categorized differently across lines, or when cycle time is measured from different points depending on who’s asking — the data is unreliable and comparisons are meaningless.
Analytics implementation requires teams to align on definitions, standardize how data is collected, and establish who is responsible for what. That alignment has value beyond the reports it enables. Standardized processes are more trainable, more auditable, and more improvable — because everyone is working from the same playbook and deviations show up in the data.
Standardization is often the most operationally valuable outcome of an analytics project — even before any insight is generated from the data itself.
As standards are established and tracked, analytics can also surface where processes are drifting from those standards in real time, enabling faster correction and more consistent outcomes across shifts and facilities.
Analytics helps manufacturers:
- Define and track standardized KPIs
- Compare performance across teams or facilities
- Identify best-performing workflows
- Establish repeatable, data-driven processes
Standardization creates a foundation for scalability and continuous improvement.
6) Actionable Insights for Better Decision-Making
Operational data is only valuable if it changes how decisions are made. The goal of analytics isn’t to produce dashboards — it’s to give the people making decisions better information, faster, and with more confidence than they had before.
This plays out at every level of the organization. Floor supervisors make better staffing and sequencing calls when they can see real-time throughput against target. Plant managers allocate improvement resources more effectively when bottleneck and yield data is available across all lines. Procurement teams negotiate from a stronger position when supplier performance data is structured and current.
The shift from gut-feel to data-grounded decisions is rarely dramatic — it’s incremental. But over months and quarters, operations teams that consistently make decisions informed by data outperform those that don’t. The compounding effect of better daily decisions is substantial.
Manufacturers can use data to:
- Identify cost drivers and inefficiencies
- Understand margin by product or customer
- Highlight underperforming areas
- Prioritize improvement initiatives
This ensures decisions are based on evidence—not intuition.
7) Supplier and Procurement Visibility
Supplier performance is one of the most significant external variables affecting manufacturing operations — and one of the least systematically tracked. Most organizations have a general sense of which suppliers are reliable, but that sense is shaped by memory and anecdote rather than structured data.
Supplier analytics tracks on-time delivery rates, lead time variability, incoming quality, and price stability across every vendor. With that data, procurement teams can score suppliers objectively, negotiate from an informed position, identify which relationships carry the most risk, and make sourcing decisions based on actual performance rather than relationship history.
On the procurement side, analytics provides visibility into spending patterns, contract compliance, and purchase order cycle times — where spend is concentrated, where it’s fragmented, and where procurement timelines are creating production delays.
Analytics enables:
- Tracking supplier lead times and reliability
- Monitoring purchase order cycle times
- Analyzing pricing trends and spend patterns
- Identifying opportunities for supplier consolidation
This leads to more strategic sourcing and fewer supply disruptions.
8) Inventory and Material Consumption Insights
Inventory problems in manufacturing are almost always information problems first. Without visibility into what’s on hand, what’s moving, and what’s sitting idle, operations default to buffers — carrying more safety stock than needed, ordering earlier than necessary, and tying up working capital in material that may not be needed for months.
Connecting inventory data to actual production consumption reveals a more accurate picture of what’s really needed and when. Which materials are you consistently running short on? Which are accumulating? Are your reorder points based on actual lead time data, or assumptions that haven’t been revisited in years?
For many manufacturers, inventory reduction is the fastest path to improving cash flow — and it starts with visibility into what you have and how fast you’re actually using it.
Analytics on consumption rates, days-on-hand, and slow-moving stock surfaces significant opportunities to reduce inventory carrying costs without increasing the risk of a stockout. For many manufacturers, this is one of the fastest ways to improve cash flow without any change to the production process itself.
With better data, manufacturers can:
- Track inventory levels across locations
- Monitor material consumption rates
- Identify excess, obsolete, or slow-moving stock
- Improve coordination between procurement and production
The result is lower carrying costs and fewer stockouts.
9) Production Planning, Capacity Optimization and Scheduling Optimization
Production schedules that don’t reflect actual capacity constraints, lead times, and demand variability create a cascade of downstream problems: missed delivery dates, expedited orders, overtime, and reactive firefighting that consumes the operational bandwidth needed for improvement work.
Analytics improves production planning by grounding schedules in real data — actual cycle times, confirmed capacity by line and shift, current WIP levels, and material availability. When the inputs to a schedule are accurate, the schedule is achievable. When deviations occur, they surface quickly enough to respond before they propagate through the plan.
Supply/Demand Balancing and Lead Time Visibility
Matching production output to demand requires visibility into both sides of the equation. On the demand side, that means structured order data: what’s been promised, when it’s due, and how it’s changing. On the supply side, it means visibility into available capacity, current WIP, and confirmed lead times from suppliers.
When both are visible in the same system, planners can identify imbalances early — a demand spike that will exceed capacity in three weeks, a supplier delay that will affect material availability in ten days — and take action while there’s still time to respond rather than react.
Key capabilities include:
- Visibility into available capacity and constraints
- Improved production scheduling based on real conditions
- Better alignment between demand and supply
Key extensions:
- Supply/demand balancing: Align production plans with actual order demand
- Lead time insights: Understand and reduce delays across the production cycle
This leads to more reliable delivery performance and better resource utilization.
Where to Get Started with Manufacturing Analytics
The most common mistake organizations make when starting with analytics is beginning with the tool rather than the problem. Software doesn’t create value — solving a specific operational problem creates value, and software is what enables it at scale. Start with the right sequence and the foundation will support everything that follows.
Start with Digitized Data
If your data isn’t digitized, it can’t be effectively analyzed.
Ensure core processes are captured in systems (ERP, MES, or even structured spreadsheets)
Eliminate disconnected, manual data silos where possible
Focus on Acute Operational Challenges
Don’t try to solve everything at once.
Start with high-impact problems like:
Late orders
Production bottlenecks
Inventory imbalances
Build analytics solutions that directly address these pain points.
Define the Business Objective First
Before building dashboards or reports, ask:
What is the goal?
What decision are we trying to improve?
What metric defines success?
Analytics should always be tied to a clear operational outcome.
Using Lasso Manufacturing Analytics Consulting Services to Build a Data Foundation
For many SMB manufacturers, building a data foundation can feel overwhelming due to limited resources and fragmented systems.
Lasso helps manufacturers:
- Consolidate and structure data from across operations
- Build automated reporting and real-time dashboards
- Establish core KPIs and performance benchmarks
- Enable workflow optimization and operational visibility
The focus is practical and results-driven: deliver immediate value through foundational analytics while setting the stage for future growth.
Progressing to Advanced Analytics and AI
Advanced analytics and AI aren’t replacements for the foundational work described in this post — they’re extensions of it. Machine learning models trained on inconsistent data produce unreliable predictions. Predictive maintenance systems built without a clean equipment data foundation generate alerts nobody trusts. AI-powered demand forecasting is only as good as the historical order and production data feeding it.
Organizations that invest in the analytics foundation first move faster and more effectively when they’re ready to add AI capabilities. The data is clean. The definitions are standardized. The team knows how to act on what the data says. Advanced tools land on infrastructure that’s ready to support them.
Part 2 of this series covers AI and advanced analytics in manufacturing — predictive maintenance, demand forecasting, computer vision quality inspection, and digital twins — and what it takes to be ready for each.