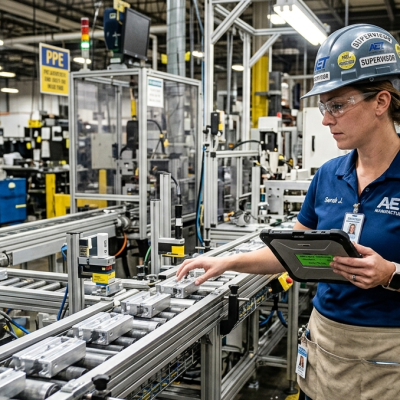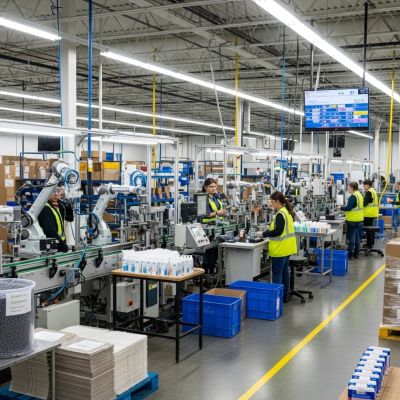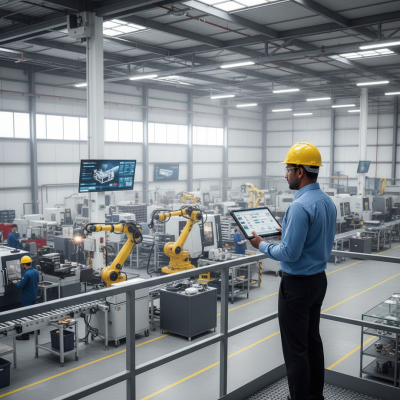
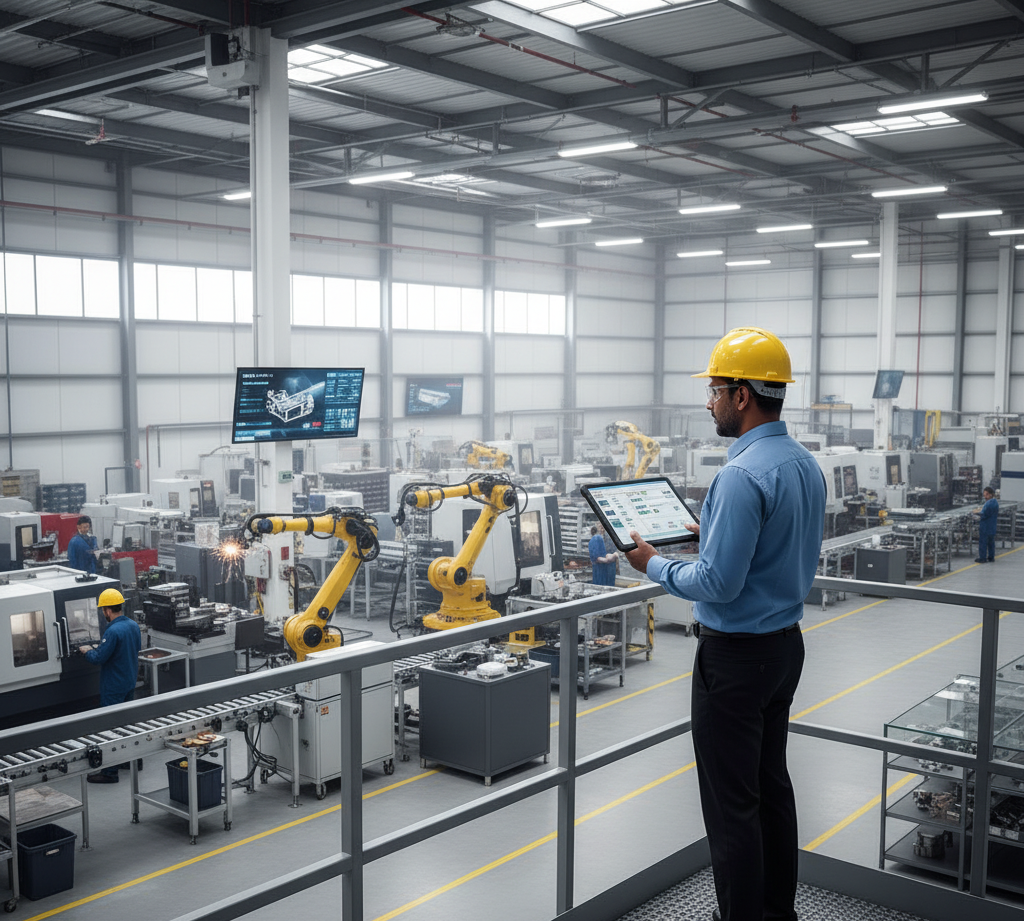
Walk into a modern production facility and you will find sensors on every machine, PLCs logging every cycle, and SCADA systems capturing temperatures, pressures, cycle counts, and throughput rates by the second. Walk into the executive suite of that same facility and you may find someone manually compiling a weekly OEE spreadsheet from three different systems.
This is the defining tension of industrial digitalization: manufacturers have more operational data than ever before, and less clarity than ever about what it means or what to do about it.
The solution is not more data. It is architecture — a deliberate, layered stack that moves information from its origin on the shop floor through collection, storage, modeling, and analysis, ultimately surfacing the right insight to the right person at the right time. What follows is a practitioner’s guide to that stack.
Layer 1: The Edge — Where Data Is Born
Every manufacturing data journey begins with a physical event: a spindle rotating, a temperature rising, a part passing a quality checkpoint. These events are captured by sensors — thermocouples, accelerometers, pressure transducers, vision systems, load cells — and converted into electrical signals.
Above the sensor layer sit Programmable Logic Controllers (PLCs) and, in machining environments, CNC controllers. These devices read sensor inputs, execute control logic, and write outputs to actuators. They also produce a continuous stream of process data — machine states, alarm codes, set points, and actual values — that constitutes the richest source of operational signal in most manufacturing environments. SCADA systems aggregate data from multiple PLCs into a unified view, often with real-time visualization.
This is where the first architectural mistake typically appears: treating all data as equal. A temperature reading sampled once per minute behaves very differently from vibration data sampled at 25,000 Hz. Aggregating them without understanding the underlying physics produces analyses that look plausible but are analytically meaningless.
Data moves from PLCs and SCADA using a variety of industrial protocols, each with different latency, payload, and reliability characteristics. Legacy protocols — Modbus, OPC-DA, PROFIBUS — are prevalent in older installed base and often require translation gateways. Modern protocols — OPC-UA, MQTT, EtherNet/IP — are designed for IP networks with built-in security and richer data modeling. The practical reality in most manufacturing environments is a mix of both, which makes protocol abstraction an early architectural priority.
Layer 2: Industrial Integration — Bridging OT and IT
The boundary between Operational Technology and Information Technology is one of the most consequential — and most frequently mismanaged — junctions in the manufacturing data stack. OT systems are engineered for determinism, safety, and uptime. IT systems are engineered for connectivity, scalability, and analytical flexibility. Their priorities are not naturally aligned.
OT teams are rightfully protective of production systems. A misconfigured polling query can consume enough PLC resources to introduce latency into control loops. An unsecured integration point becomes a cybersecurity vulnerability in a network that controls physical equipment. These concerns are legitimate, and any integration architecture must take them seriously.
We consistently find that the most successful OT/IT integrations are those where both teams are involved from the architecture phase — not where an IT-led project hands off a connector to OT after the fact and asks them to accommodate it.
The emergence of IIoT platforms and edge computing has provided a more robust architectural pattern for this junction. Rather than pulling data directly from PLCs into cloud or enterprise systems, an edge compute layer can buffer data locally, apply initial filtering and contextual enrichment close to the source, execute lightweight analytics for time-critical use cases, and enforce security boundaries between OT and IT networks. Common platforms in this layer include Ignition, PTC ThingWorx, Azure IoT Edge, and AWS Greengrass.
The process historian — OSIsoft PI (now AVEVA PI), Aspentech IP.21, FactoryTalk Historian — has been the canonical store for time-series operational data for decades. It is not going away, but its role is evolving. Modern stacks often treat the historian as a high-fidelity source of operational truth while routing subsets of data into cloud-native platforms for broader analytical use. The key architectural question is not “historian or cloud” — it is what lives where, and why.
Layer 3: The Data Platform — Storing, Transforming, and Modeling
Once data crosses the OT/IT boundary, ingestion begins: moving data from source systems into a centralized platform. The sources are diverse — historian time-series, MES transactions, ERP work orders, quality system records, maintenance tickets from CMMS, and increasingly, unstructured data from vision systems and operator notes. Robust ingestion requires a pipeline architecture that handles batch loads from ERP and MES on scheduled intervals, real-time streaming from historians and IIoT platforms, schema evolution as source systems change, and data quality checks at the point of ingestion rather than after the fact.
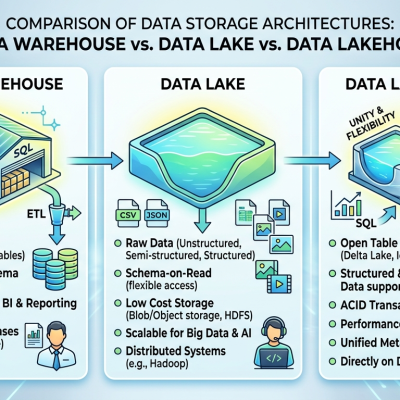
The data warehouse — whether Snowflake, Databricks, Azure Synapse, BigQuery, or Redshift — is the analytical hub of the modern manufacturing data stack. What makes a manufacturing data warehouse architecturally distinct from a generic enterprise warehouse is the centrality of time-series data and the need to join high-frequency operational signals with lower-frequency transactional records. A quality defect event from a vision system has to join cleanly with the work order from ERP, the process parameters from the historian at that timestamp, and the operator log from the MES. Designing the schemas and join keys that make this possible is non-trivial, and it is where domain-specific data modeling expertise pays its largest dividends.
The clients we see struggle most with their data warehouses are those who modeled their operational data like a transactional database. Time-series manufacturing data has fundamentally different cardinality, grain, and join patterns than ERP data. Forcing it into the same modeling conventions produces a warehouse that is technically functional and analytically frustrating.
Raw data from operational systems is not analysis-ready. PLC tags need to be mapped to equipment hierarchy. Alarm codes need to be translated into human-readable state descriptions. Production quantities need to be normalized against planned schedules to compute OEE. This transformation work — converting source data into analytical constructs — is where the most consequential intellectual work in manufacturing analytics occurs.
The semantic layer sits above the warehouse and below visualization tools. It defines metrics, dimensions, and business logic in a way that is consistent across all downstream consumers. Without it, two analysts can query the same warehouse and get different OEE numbers because they made different assumptions about planned downtime or speed loss definitions. Tools like dbt, Looker LookML, AtScale, and Cube.js are commonly used to implement semantic layers. The key discipline is defining manufacturing KPIs — OEE, TEEP, yield, scrap rate, cycle time, changeover duration — with precision and consistency before they are embedded in any model.
Layer 4: Analytics — From Descriptive to Prescriptive
Not all analytics are created equal, and the appropriate level of sophistication depends on the maturity of the underlying data stack. We use a four-level framework with clients:
Descriptive analytics answers “what happened?” through historical dashboards and reports. Diagnostic analytics answers “why did it happen?” through drill-down analysis and root-cause tooling. Predictive analytics answers “what will happen?” through machine learning models and statistical process control. Prescriptive analytics answers “what should we do?” through optimization engines and closed-loop systems.
Most manufacturing organizations are still in the descriptive tier for the majority of their operations. That is not a failure — it reflects the real difficulty of building the data foundation that makes higher-order analytics possible. The trap is investing in predictive or prescriptive capabilities before the descriptive layer is reliable. A machine learning model built on inconsistently labeled, poorly governed data will produce outputs that operators learn to ignore.
Manufacturing analytics also has a set of domain-specific patterns that do not arise in most enterprise data contexts. Process signature analysis — identifying the characteristic shape of a healthy production cycle and detecting deviations from it — requires time-aligned, high-frequency data and analytical tools that can operate on that data efficiently. General-purpose BI tools are often inadequate for this work. Purpose-built time-series analytics platforms like Seeq or TrendMiner are specifically designed for process engineers working in this analytical mode.
Machine learning has genuine application in manufacturing — predictive quality, anomaly detection, computer vision for defect classification — but it is deployed successfully far less often than it is piloted. The gap between a promising pilot and a production ML deployment is wide, and the reasons are almost always data-related rather than algorithm-related. The organizations we have seen deploy ML successfully in production environments share a common trait: they invested heavily in data infrastructure and labeling discipline before they invested in model sophistication. The algorithm is rarely the limiting factor.
Layer 5: Presentation — The Dashboard and Beyond
The executive dashboard is visible, but it is not the most important presentation layer in a manufacturing data stack. The most consequential dashboards are the ones used by operators, supervisors, and process engineers on the shop floor — the people who can actually act on what they see, in the time window during which action is still possible.
Designing for operational users requires different principles than designing for executive consumption. Latency requirements are measured in seconds, not hours — a dashboard showing machine state that is 15 minutes delayed is operationally useless. Actionability must be explicit; operators should never have to determine what a metric means for their next action. Alarm management is a distinct discipline; a dashboard that surfaces too many alerts will be ignored. And context sensitivity matters — a finishing department supervisor needs a different view than a maintenance technician responding to the same downtime event.
The executive dashboard, by contrast, draws from the top of the stack: aggregated, governed, semantically defined metrics that reflect business performance rather than machine state. What executives need from the data stack is not more metrics. It is fewer, better ones — with confidence in their accuracy and enough context to understand what they mean for capital allocation, operational priorities, and strategic decisions.
The most common failure in executive dashboard design is the absence of governing definitions. When the CFO’s OEE number and the plant manager’s OEE number disagree, neither is trusted. Resolving that disagreement requires going back to the semantic layer — an architectural problem, not a dashboard problem. Dashboard disputes are almost always data architecture disputes in disguise.
Common Failure Patterns
Across engagements with discrete and process manufacturers at various stages of digital maturity, certain failure patterns recur with enough regularity to be worth naming explicitly.
The Proof-of-Concept Trap. Organizations pilot advanced analytics on a single asset, demonstrate compelling results, and then struggle to scale because the proof-of-concept was built on bespoke infrastructure never designed for enterprise deployment. Architecture-first thinking — asking how this will scale before you demonstrate that it works — is consistently undervalued in manufacturing analytics programs.
The Missing Middle. Many manufacturers have invested in both edge technology and visualization tools without adequately investing in the middle layers: ingestion infrastructure, data warehousing, and semantic modeling. The result is dashboards that are visually sophisticated but analytically shallow, because the foundation cannot support deeper computation.
The Governance Deficit. Every ungoverned metric definition is a future reconciliation project. Every undocumented transformation is a future debugging session. Every unresolved naming inconsistency between systems is a join key that will fail in production. The organizations that invest in governance early spend less time firefighting later.
The OT Partnership Failure. Analytics programs driven entirely by IT or a centralized analytics function, without meaningful partnership with OT and operations, consistently underperform. The domain knowledge required to make manufacturing analytics actionable lives in the plant. Building the data stack without the people who understand the process is a reliable path to analytically correct but operationally irrelevant outputs.
Conclusion
The manufacturing data stack is not a technology problem. It is an organizational and architectural discipline — one that requires coordinated investment across OT and IT, operations and analytics, data engineering and domain expertise.
The gap between shop floor sensor and executive dashboard is not primarily a data gap. It is a gap in the systems, processes, and governance structures that transform raw operational signal into reliable business intelligence. Organizations that build this stack deliberately — starting with a sound foundation, progressing through enrichment, and earning the right to analytical sophistication through accumulated data quality — consistently outperform those that skip steps in pursuit of the most visible outputs.
The executive dashboard is the last mile. The real work is everything that comes before it.