The most expensive machines in your factory are already speaking. They emit vibration signatures, temperature curves, cycle counts, and pressure readings continuously — a constant stream of information about their own health, performance, and impending failure. The problem isn’t a lack of data. It’s that most manufacturers have no infrastructure in place to listen.
This post walks through the entire industrial data stack — from what it actually means to “connect” a machine, to the protocols used to pull data off aging equipment, to the Machine Learning models that generate actionable insight from that data.
What does it mean to connect factory machines to a data layer?
Connecting a factory machine to a data layer does not simply mean attaching a sensor to it, or giving it an IP address, or being able to view a live dashboard of its current status. Those are components of the answer — but the data layer is something more architectural.
A data layer is the full set of infrastructure that sits between raw machine signals and the people and systems that need to act on them. It encompasses how data is extracted from machines, how it’s transported and buffered, how it’s cleaned and enriched, how it’s stored at multiple timescales, and how it’s made queryable by analysts, engineers, and automated systems alike.
To make this concrete: a CNC machining center generates spindle load readings many times per second. “Connecting it to a data layer” means that reading is captured by an edge gateway speaking the machine’s native protocol, timestamped and buffered locally, transmitted to a cloud message broker, enriched with asset metadata (which machine, which line, which part program is running), written to a time-series database for real-time querying, archived to a data lake for long-term retention, and ultimately available to a dashboard on the shop floor, a predictive maintenance model running in the cloud, and a Power BI report in the maintenance manager’s weekly review — all simultaneously, without any of those consumers interfering with each other.
That end-to-end chain — from electrical signal to analytical system — is what “connecting to a data layer” actually means. Each link in that chain has its own engineering requirements, failure modes, and technology choices. The rest of this post addresses each layer in turn.
The key distinction
A connected machine is not just a machine you can see. It’s a machine whose behavior is continuously captured, contextualized, and made available — durably, reliably, and at scale — to every system that needs to reason about it.
Why connect factory machines to a data layer?
The traditional answer is predictive maintenance: catch failures before they happen, reduce unplanned downtime, extend asset life. That’s real and valuable — unplanned downtime costs manufacturers a significant amount across industries. But the strategic case for a machine data layer goes much further.
When machine telemetry flows into a centralized, queryable data layer, you gain the ability to correlate machine behavior with product quality outcomes. A subtle shift in spindle vibration that you wouldn’t catch with periodic manual inspection turns out to predict surface finish defects three production runs later. That kind of cross-signal correlation is impossible without a data layer — it requires the ability to join machine sensor streams with quality inspection records and production schedules in a common analytical environment.
Beyond maintenance and quality, a connected machine fleet enables accurate OEE (Overall Equipment Effectiveness) measurement, energy consumption optimization, capacity planning grounded in actual cycle time data, and the kind of process knowledge that survives workforce turnover. The experienced operator who knows that Machine 7 runs hot in summer and needs recalibration is eventually going to retire. Their institutional knowledge doesn’t have to leave with them if it’s been encoded in data.
The core value proposition
A machine data layer converts implicit, perishable operational knowledge into explicit, durable, queryable intelligence — and creates the foundation for applying modern AI to manufacturing problems.
How to connect different types of machines to a data layer
The most important thing to understand about connecting factory machines is that there is no single protocol or method. A modern factory could contain equipment spanning five or six decades of manufacturing history, each generation speaking a different language. Your strategy has to accommodate legacy PLC-controlled equipment, mid-vintage CNC machines with proprietary controllers, and modern IoT-ready equipment with native API connectivity — often simultaneously.
Industrial communication protocols
The dominant modern standard for machine-to-system communication. Platform-independent, security-aware, and supported by most major equipment vendors. The ideal protocol when available.
The universal legacy protocol. Simple, robust, and ubiquitous on older PLCs and field devices. Modbus TCP (Ethernet) is nearly as common as OPC-UA on the plant floor today.
A lightweight publish-subscribe protocol designed for constrained environments. Increasingly common as the transport layer for industrial IoT sensors pushing data to edge gateways.
Real-time industrial Ethernet protocols common in Siemens and Rockwell Automation environments respectively. High-speed, deterministic, and primarily used for control — but can be tapped for data acquisition.
An open standard developed specifically for machine tool data. Widely supported by CNC manufacturers including Mazak, Okuma, and Haas. Produces structured XML data streams.
Modern cloud-connected machines increasingly expose native REST APIs or push data via webhooks. Integration here is closer to software engineering than traditional industrial networking.
Connection strategies by machine era
For legacy machines without any network connectivity, the primary option is retrofitting: attaching edge sensors (vibration, current, temperature) directly to the machine housing and connecting those sensors to a gateway device. This approach is non-invasive, requires no modification to the machine’s control system, and can be deployed in hours. The tradeoff is that you get indirect signal proxies rather than the rich parametric data available from the controller itself.
For mid-vintage PLCs and CNCs, the path typically involves a gateway device that speaks the machine’s native protocol (Modbus, PROFINET, etc.) on one side and a modern transport protocol (MQTT or HTTPS) on the other. Industrial protocol conversion gateways from vendors like Kepware, Moxa, and Advantech are the workhorses of this integration approach.
For modern equipment with OPC-UA or native cloud connectivity, integration is significantly simpler — the machine exposes a structured data interface and the gateway or edge device acts as a thin relay and buffer rather than a heavy translation layer.
Different types of machines to track
Different categories of manufacturing equipment generate fundamentally different kinds of telemetry. Understanding what data each machine type produces — and what that data can tell you — is essential for prioritizing your instrumentation roadmap.
CNC Machining Centers
Spindle load, RPM, feed rate, axis position, tool wear counters, cycle time per part, coolant flow and temperature, servo motor current. Ideal for detecting tool wear drift, chatter, and cycle time degradation.
Injection Molding Machines
Injection pressure and speed, mold temperature (zone-by-zone), clamping force, screw position and recovery time, cycle count. Shot-to-shot consistency is the key signal — deviations predict dimensional defects.
Industrial Robots
Joint torque and position, path accuracy, cycle time, error codes, end-of-arm tooling force/torque. Joint torque trends are a leading indicator of gearbox degradation.
Welding Equipment
Weld current, voltage, wire feed speed, arc-on time, inter-pass temperature. Deviations in current-voltage ratio are strongly correlated with weld defects.
Compressors & HVAC
Discharge pressure and temperature, suction pressure, motor current draw, vibration, runtime hours. Bearing failure and refrigerant loss both produce characteristic sensor signatures.
Conveyors & Material Handling
Belt speed, motor amperage, weight/load sensors, jam detection, throughput counts. Simple signals, but essential for bottleneck identification and OEE calculation.
Presses & Stamping Equipment
Tonnage (force curve per stroke), ram position and velocity, die cushion pressure, stroke count, die temperature. Force curve shape analysis is a powerful quality signal.
Pumps & Fluid Systems
Flow rate, inlet/outlet pressure, motor current, vibration signature, bearing temperature. Cavitation, impeller wear, and seal degradation each produce distinct vibration patterns.
Modern factory telemetry stack
A well-designed factory telemetry stack is composed of seven distinct layers, each with a specific responsibility. Understanding the function and design considerations at each layer is the key to building a system that’s resilient, cost-effective, and analytically powerful.
PLCs, CNCs, robots, and sensors constitute the data source. At this layer, data exists as raw electrical signals, controller registers, or proprietary protocol frames. The primary engineering challenge is exposure: making this data accessible without disrupting machine operation or voiding warranties.
Industrial gateway devices or purpose-built edge compute hardware sit physically on or near the machine. They handle protocol translation, local buffering (critical for network interruption resilience), initial data filtering to reduce bandwidth, and secure forwarding to the cloud. Well-designed edge gateways continue functioning and storing data locally even when upstream connectivity is lost.
The cloud entry point for machine data. A message broker or event streaming platform ingests data from potentially thousands of edge devices simultaneously, buffers it durably, and fans it out to downstream consumers. This layer must handle massive write throughput, support multiple independent consumers (stream processors, storage writers, alerting systems), and provide replay capability.
Streaming data is enriched and transformed in flight. Common operations include unit conversion, data quality filtering, windowed aggregations (rolling averages, min/max over a sliding window), joining sensor streams with asset metadata, and real-time threshold alerting. This is where “raw signal” becomes “engineering unit with context.”
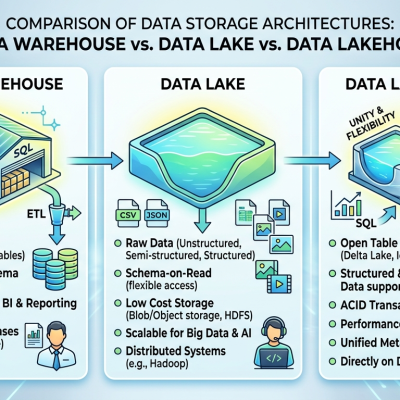
Machine telemetry requires a tiered storage strategy. Hot storage (time series databases) serves recent data at sub-second query latency — essential for real-time dashboards and alerting. The two dominant purpose-built options are TimescaleDB, a PostgreSQL extension that adds time-series optimizations while preserving full SQL compatibility, and InfluxDB, a dedicated TSDB with its own query language (Flux) and excellent Grafana integration. Cold storage in an object-store data lake (S3, GCS, Azure Data Lake) retains the full historical record at low cost — months or years of raw sensor data that would be prohibitively expensive in a hot database. A data warehouse (Synapse, Snowflake, BigQuery, Redshift) provides the structured, columnar environment for cross-functional analytics: joining machine performance with ERP data, quality records, and financial information.
Scheduled batch jobs perform heavy data transformations, feature engineering, and model training on historical data. dbt is the de facto standard for SQL-based transformation orchestration in the warehouse. Orchestration tools manage pipeline scheduling and dependencies. ML model training pipelines live here — consuming processed feature data from the data lake and producing trained model artifacts that are then deployed back into the stream processing layer for real-time inference.
Two tools dominate industrial telemetry visualization. Grafana is purpose-built for time-series data — it has native integrations with InfluxDB, TimescaleDB, and virtually every other TSDB, and its panel types (time series, stat, gauge, alert list) are designed exactly for machine monitoring use cases. It’s the standard choice for shop-floor-facing operational dashboards. Power BI complements Grafana for business-facing analytics: trend reporting, OEE summaries, maintenance cost analysis, and the cross-functional dashboards that combine machine data with ERP and financial data in the warehouse.
Advanced analytics with machine data
Once a machine data layer is operational and historical data has accumulated, the next horizon is applying machine learning to generate insight that no threshold alert or dashboard can produce. The ML model types applicable to machine telemetry map naturally onto different operational questions.
| Model type | Operational question answered | Key technique |
|---|---|---|
| Anomaly Detection | Is this machine behaving unusually right now? Has it drifted from its baseline operating signature? | Isolation Forest, Autoencoders, LSTM-based reconstruction error, statistical process control extensions |
| Time-Series Forecasting | How will this machine’s performance metric evolve over the next hours, days, or weeks? | Prophet, SARIMA, Temporal Fusion Transformer, N-BEATS — applied to degradation curves and performance trend extrapolation |
| Survival Models | What is the probability this machine will fail within the next 30 days? What is its remaining useful life? | Cox Proportional Hazards, Weibull regression, DeepHit neural survival models trained on historical failure event data |
| Classification Models | What type of fault condition is present? Which alert category should be triggered and routed to which maintenance team? | Gradient boosted trees (XGBoost, LightGBM), Random Forest, 1D-CNN on raw vibration signals — typically trained on labeled fault events |
| Reinforcement Learning | What are the optimal machine settings to maximize throughput, quality, and energy efficiency simultaneously? | Policy gradient methods, model-based RL — deployed as adaptive process control systems that adjust setpoints in real time based on sensor feedback |
In practice, most organizations follow a natural progression: anomaly detection and classification first (relatively quick to deploy, high operational value), time-series forecasting and survival models next (require more history), and RL-based adaptive control last (highest complexity and the longest deployment cycle, but also the highest ceiling for impact).
Common challenges
Heterogeneous legacy equipment
Most factories contain machines from multiple vendors across multiple decades. There is no single integration path — each machine generation requires different protocols, gateway configurations, and data normalization logic. A realistic integration roadmap should tier machines by data value and integration complexity rather than trying to connect everything at once.
IT/OT network separation
Industrial control networks (OT) and business IT networks are often intentionally air-gapped for security reasons. Routing data from the shop floor to the cloud requires navigating this boundary carefully — with DMZ architectures, data diodes, or purpose-built industrial connectivity platforms — without creating security vulnerabilities in either direction.
Data quality and sensor reliability
Industrial sensors fail, drift, and produce spurious readings. A machine data pipeline that doesn’t account for missing values, outliers, and sensor faults will produce analytical results that erode trust quickly. Robust data quality monitoring and imputation strategies are as important as the ingestion infrastructure itself.
Labeling failure events for supervised learning
Training classification and survival models requires labeled historical data: sensor readings paired with known failure events. This data is often scattered across CMMS systems, paper maintenance logs, and tribal knowledge. Collecting and cleaning failure event history is one of the most labor-intensive parts of a predictive analytics program.
Organizational adoption
The maintenance technician who has managed these machines for 20 years using intuition and experience is not automatically going to trust an algorithm. Change management, user experience design on operational dashboards, and involving end users in model validation are as critical to project success as the technical architecture.
Total cost of ownership
Cloud infrastructure for time-series data at industrial scale — thousands of tags at high sample rates — can generate significant and surprising costs. Storage tiering, data retention policies, and sample rate optimization are essential from day one, not afterthoughts.
Next steps for implementation
The path from “our machines generate data” to “our machines are connected to a data layer that drives real decisions” is a multi-step journey that can range from several weeks to several months for a full deployment depending on the objectives and requirements. The first step is almost always the same: conduct a machine asset inventory and data value assessment to understand which machines, if instrumented, would generate the most analytically valuable data — and what the integration path for each looks like.
Organizations that attempt to build this infrastructure without experienced guidance frequently discover the hard way that industrial protocol integration is not the same as enterprise software integration, that TSDB schema design choices made early are difficult to undo, and that the gap between “data pipeline running” and “model in production generating business value” is wider than it looks from the outside.
Avoiding common pitfalls
The highest-impact early decisions — data model design, storage tier selection, and edge architecture — are also the hardest to reverse. Getting them right from the start is the best ROI on any investment in this program.
Ready to connect your factory floor?
Lasso Manufacturing Analytics helps industrial manufacturers design, build, and operationalize machine telemetry stacks — from protocol integration on legacy equipment to ML model deployment. We start with a comprehensive assessment of your current operations and then guide you through developing a tailored data strategy. We handle the full end-to-end implementation of your factory telemetry and analytics solution, followed by ongoing post-implementation support to ensure long-term success and continuous improvement.