Every capital equipment purchase in a plant goes through a rigorous justification process. Tooling, automation, conveyors — every dollar gets a discounted cash flow, a payback period, a sign-off chain. Yet when it comes to analytics software and data infrastructure, the same discipline often evaporates. Procurement decisions get made on demo impressions and vendor case studies, with the real reckoning saved for the quarterly review twelve months post-implementation.
That’s backwards. And it’s expensive.
At Lasso, we’ve helped dozens of manufacturers structure pre-investment ROI analyses that are rigorous enough to drive a capital approval and honest enough to surface projects that shouldn’t proceed. This article walks through the methodology we use — not as a sales exercise, but as a genuine decision framework.
Why pre-investment ROI is different from post-investment measurement
Post-implementation ROI is a forensic exercise: you’re reconstructing what happened. Pre-investment ROI is a hypothesis. The discipline of building it forces you to be explicit about three things most analytics pitches gloss over: the baseline you’re measuring from, the mechanism by which data changes behavior, and the time it takes for that behavioral change to produce financial results.
Without those three anchors, you don’t have an ROI model. You have a marketing deck.
Step one: Establish a credible baseline
Before you can estimate what analytics will save, you need to know what the problem is costing you right now. This sounds obvious. It is rarely done well.
Baseline inventory — the four loss categories
- Availability losses — unplanned downtime, changeover time, startup and shutdown losses. Pull 12 months of OEE data if you have it; work-order logs if you don’t.
- Performance losses — speed losses, minor stoppages, idling. The gap between nameplate capacity and actual throughput is often larger than plant leadership believes.
- Quality losses — scrap, rework, returns. Capture both the direct material cost and the labor cost of rework. Don’t forget the hidden cost of customer-facing defects.
- Inventory and scheduling losses — excess WIP, expedite costs, missed delivery penalties. These are often the largest bucket in high-mix environments and the least visible in standard cost accounting.
The goal at this stage is not precision — it’s order of magnitude. If your plant loses roughly $4 million per year to unplanned downtime and you’re considering a $400,000 analytics investment, you’re operating in a plausible value zone. If the losses are $400,000 and the investment is the same number, you need a very different conversation.
Step two: Define the addressable fraction
Analytics does not eliminate losses. It makes losses visible faster and gives operators and engineers the information they need to act. How much of each loss category is actually addressable by better data — as opposed to requiring capital investment, process redesign, or additional headcount — is the most important question in the model.
These are starting assumptions, not guarantees. The honest version of pre-investment modeling includes a range: conservative, base, and upside scenarios. Any vendor or consultant who gives you a single-point estimate is either naive or selling something.
| Loss category | Illustrative annual cost | Conservative addressable % | Base addressable % | Upside addressable % |
|---|---|---|---|---|
| Unplanned downtime | $2.4M | 20% | 35% | 50% |
| Quality / scrap / rework | $1.1M | 15% | 28% | 40% |
| Scheduling / expedite | $800K | 10% | 20% | 35% |
| Energy waste | $350K | 8% | 15% | 22% |
| Total addressable value | $4.65M baseline | $600K | $1.1M | $1.7M |
Step three: Map the value-creation mechanism
This is where most pre-investment analyses fail. They jump from “we’ll have data” to “we’ll save money” without describing the causal chain in between. The causal chain is everything, because it tells you what has to be true for the ROI to materialize.
- The data must be captured reliably and at the right granularity — not every sensor integration goes smoothly on the first attempt.
- The insight must be surfaced to the right person at the right time — dashboards no one uses don’t save money.
- That person must have the authority and the standard work to act on the insight — if the maintenance technician sees the alert but has no parts and no escalation path, the alert is noise.
- The action must actually prevent or reduce the loss — this requires process change, not just data visibility.
At each link in this chain, there is friction. Your pre-investment model should explicitly account for it. A useful proxy: how mature is your organization’s existing relationship with data? Plants that already have engineers who use data routinely will capture value faster than those starting from near-zero data literacy.
Step four: Build the full cost model
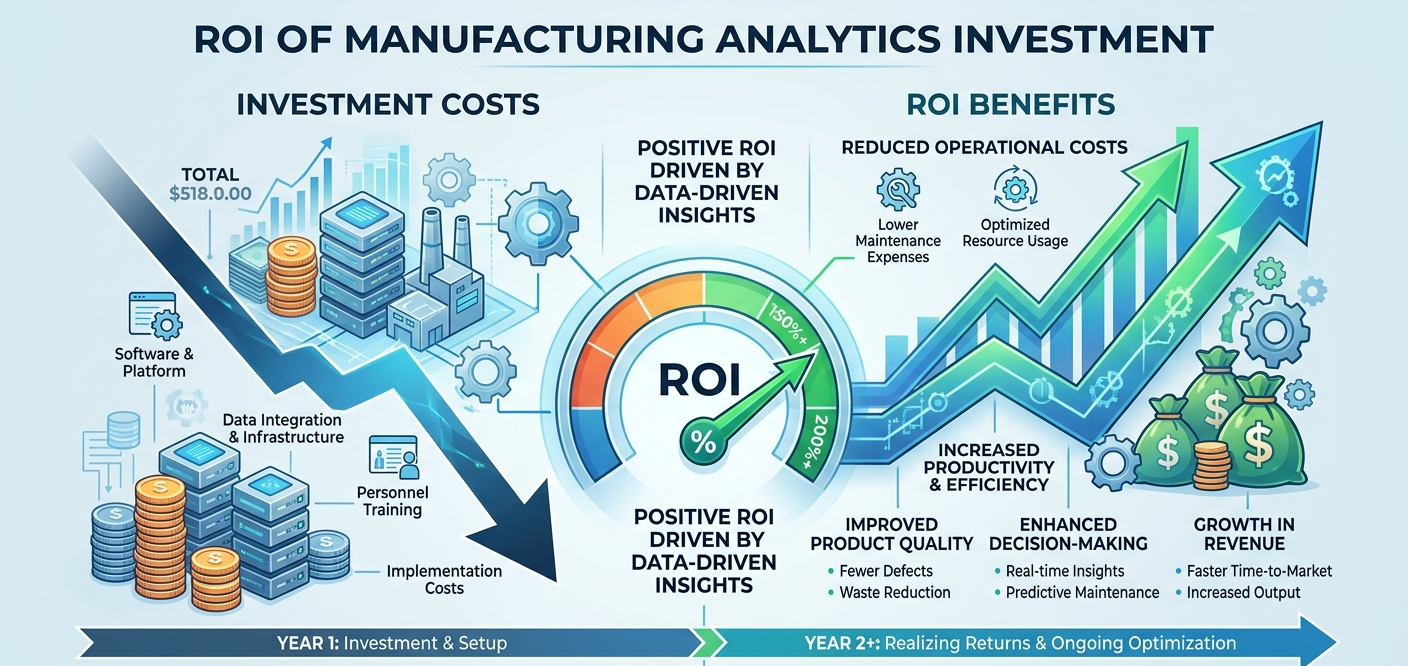
Software subscription or license costs are visible. The rest are frequently underestimated.
A rough rule of thumb: for every dollar of software subscription cost, plan for 60–80 cents of ancillary cost in the first year. This ratio improves over time as infrastructure is established, but first-year TCO surprises are one of the most common sources of post-implementation dissatisfaction we see.
Step five: Model the timing, not just the magnitude
An analytics platform that breaks even in year one and generates $1M annually thereafter is a fundamentally different investment from one that costs heavily for two years before producing meaningful return. Both might show the same five-year NPV. Only one is likely to survive an economic downturn or a change in plant leadership.
A credible timing model accounts for three phases: the integration and configuration period (typically three to six months, during which costs accrue but value does not), the ramp period (six to eighteen months, during which early wins appear but adoption is partial), and the steady-state period (where the addressable value fractions from step two actually apply).
Step six: Sanity-check against comparable projects
Benchmarks are imperfect, but they are useful guardrails. If your model is projecting 70% reduction in unplanned downtime in year one, it should be compared against documented outcomes from similar implementations in similar process environments — not against the best-case slide in a vendor presentation.
Good questions to ask any vendor or consultant: What is the median ROI achieved by clients at your plant size and complexity? What percentage of implementations reach the projected ROI within the projected timeline? What are the most common reasons implementations underperform?
A partner who can answer these questions with data — not anecdotes — is more likely to help you build a model you can actually defend internally.
What a defensible ROI model looks like
By the end of this process, you should have a one-page financial summary that shows: the total three-year cost of ownership broken down by category; the conservative, base, and upside value scenarios with explicit assumptions for each; the net present value and internal rate of return under each scenario; and the payback period under base assumptions.
The model should be buildable in a spreadsheet in a few hours, not weeks. Its value is not in its precision — no pre-investment model is precise — but in forcing explicit assumptions that can be tracked against actual results and revisited if the project starts to drift.
The pre-investment checklist
- ✓Twelve months of baseline loss data, segmented by category
- ✓Addressable fraction assumptions with explicit rationale for each
- ✓Full causal chain documented for the primary value driver
- ✓Total cost of ownership including infrastructure, labor, and training
- ✓Conservative / base / upside scenario model with timing
- ✓Benchmark comparison against documented comparable outcomes
- ✓Named owner for tracking actuals against model post-implementation
A note on projects that shouldn't proceed
This framework is designed to surface good investments. It also surfaces bad ones. If your baseline losses are modest relative to the investment, if your organization lacks the change-management capacity to close the data-to-action loop, or if the causal mechanism depends on assumptions that don’t hold in your environment — a rigorous pre-investment model will tell you that. That is a feature, not a failure.
Some of the best work we’ve done for clients is helping them decline analytics investments that wouldn’t have paid off, or restructure them into smaller pilots with clearer success criteria before committing to a full rollout. The goal is not to justify spending. It is to make good decisions.
The manufacturers who treat analytics as a capital investment — with the same rigor they apply to any other capital investment — are the ones who get the results they modeled. That discipline starts before the contract is signed.
Aligning your data strategy to business goals
The ROI framework in this article is only as strong as the strategy behind it. One of the most common failure modes we see is manufacturers selecting and implementing analytics tools before they’ve answered a more fundamental question: what business outcomes are we actually trying to move, and does our data infrastructure connect to those outcomes?
That’s where a data strategy engagement with Lasso starts. We work with your operations, finance, and IT leadership to map your highest-priority business goals — whether that’s margin improvement, on-time delivery, capacity growth, or cost reduction — and then design a data architecture and analytics roadmap that is explicitly tied to those goals. Every data source, every KPI, every dashboard is justified by its connection to a specific financial outcome.
The result is an implementation plan that doesn’t just tell you what to buy — it tells you why it will work, what it will take to realize the value, and how you’ll know if it’s on track. Manufacturers who do this work upfront close the gap between projected and realized ROI faster than those who retrofit strategy onto an already-chosen platform.