Excel is a remarkable tool. It helped build supply chains, track inventory levels, and power production reporting long before purpose-built manufacturing software was accessible to mid-sized operations. For many manufacturers, the humble spreadsheet was the first real step toward data-driven decision-making.
But there’s a reason we don’t build skyscrapers with hand saws. Tools that are perfect for one scale of problem become liabilities at another. And in our experience working with manufacturing operations across discrete, process, and mixed-mode environments, we’ve seen the same pattern repeat: a business grows, Excel stays, and the gap between what leadership needs to know and what the data can actually tell them widens — silently, expensively, until something breaks.
This article is about recognizing that gap before it breaks you.
Why Excel Feels Like It's Working (Until It Isn't)
The insidious thing about Excel-induced operational drag is that it rarely announces itself. Your team is producing reports. Numbers are landing in inboxes. Management has dashboards — of a sort. The operation feels like it’s running on data.
What’s actually happening is that a growing portion of your workforce is spending meaningful time on data hygiene instead of data analysis. The spreadsheet hasn’t failed yet, so no one’s declared a crisis. But the hidden costs are compounding.
The signals are there if you know where to look. Below are the eight most reliable indicators we’ve observed — the ones that tell us, with high confidence, that a manufacturing business has reached the limits of what spreadsheet-based operations can support.
The 8 Warning Signs
Your reports are out of date before they’re finished
If your production report for Monday morning requires someone to work Friday afternoon consolidating data from the floor, the shift supervisors, and the ERP, you’re not reporting on reality — you’re reporting on a reconstruction of it. When decisions are made on data that’s 24 to 72 hours stale in a high-throughput environment, the cost is real even if it’s invisible on the P&L.
You have multiple “versions of truth” floating around
This is one of the most common symptoms we encounter. Operations has one spreadsheet. Finance has another. The plant manager has a third she built herself because the other two didn’t match. When a single question — “What was our OEE last quarter?” — produces three different answers depending on who you ask, your data infrastructure has failed regardless of how sophisticated any individual spreadsheet looks.
Key person dependency has become a structural risk
There’s almost always someone in an Excel-heavy operation who built the master workbook, knows how it works, and whose departure or illness would be operationally catastrophic. If your reporting capability lives in one person’s head alongside a complex VLOOKUP architecture, you don’t have a data system — you have a single point of failure wearing a data system’s clothing.
You can’t answer basic operational questions in real time
A plant manager who needs to know current WIP levels, line efficiency by shift, or yield trends for the past 30 days should be able to access that information in under 60 seconds. If the answer is “I’ll have to pull that together and get back to you,” the organization is flying partially blind. Decisions get made on instinct when data has a two-day retrieval time.
Your compliance and audit trail is held together with hope
For manufacturers in regulated industries — food and beverage, medical devices, aerospace, automotive — traceability isn’t optional. If reconstructing a material genealogy or demonstrating process adherence requires manually cross-referencing multiple workbooks, you are one audit or recall event away from a very expensive problem. Excel was not designed as a compliance system, and using it as one introduces risk that doesn’t appear until it does — suddenly and entirely.
Scaling the business means scaling the spreadsheet headcount
When adding a new product line, shift, or facility means hiring another person to manage the associated data workload, you’ve built a fundamentally non-scalable data operation. Proper analytics infrastructure should allow the business to scale without a linear increase in data management labor. If your growth plan implicitly assumes more spreadsheet operators, that’s a planning risk worth addressing.
You’re discovering errors after they’ve caused downstream problems
A formula error in a scheduling spreadsheet that doesn’t surface until a customer shipment is short. An inventory discrepancy that wasn’t caught until physical count. A quality data entry mistake that propagated through three reports before someone noticed. These aren’t isolated incidents in Excel-heavy operations — they’re a pattern. Manual data handling introduces manual error, and in manufacturing, errors have physical consequences.
Your team spends more time managing data than acting on it
This is perhaps the most significant cost, and the hardest to quantify. When your best operational minds are spending two hours a day reformatting exports, reconciling tables, and rebuilding reports that broke when someone changed a column header, that cognitive capacity is gone. The opportunity cost isn’t just the labor hours — it’s the strategic analysis, the continuous improvement initiatives, the proactive problem-solving that never happens because the data just took all morning.
The Real Cost of Staying
One objection we hear consistently when this conversation comes up is about switching costs. New systems are expensive. Implementation is disruptive. The team knows Excel. These are legitimate considerations, and we don’t dismiss them.
But the cost of staying is also real — it’s just harder to see on a spreadsheet.
| Cost Category | How It Shows Up | Visibility |
|---|---|---|
| Labor – data management | Hours spent consolidating, cleaning, rebuilding reports | Low — buried in general labor |
| Defect and rework exposure | Quality issues not caught in time due to stale data | Medium — appears as quality cost |
| Missed efficiency gains | OEE improvements not identified due to limited visibility | Very Low — never appears |
| Compliance risk | Audit failures, recall exposure, traceability gaps | Zero — until it materializes |
| Decision latency | Slow response to yield drops, equipment issues, demand shifts | Very Low — absorbed as “normal” |
| Talent retention | Analysts leave for environments with better tooling | Medium — shows as turnover |
The costs that are hardest to see are often the largest. The efficiency improvements your operation never made because no one had the data to identify them don’t appear anywhere on a balance sheet. But they are as real as any line item.
What "The Right Tool" Actually Looks Like
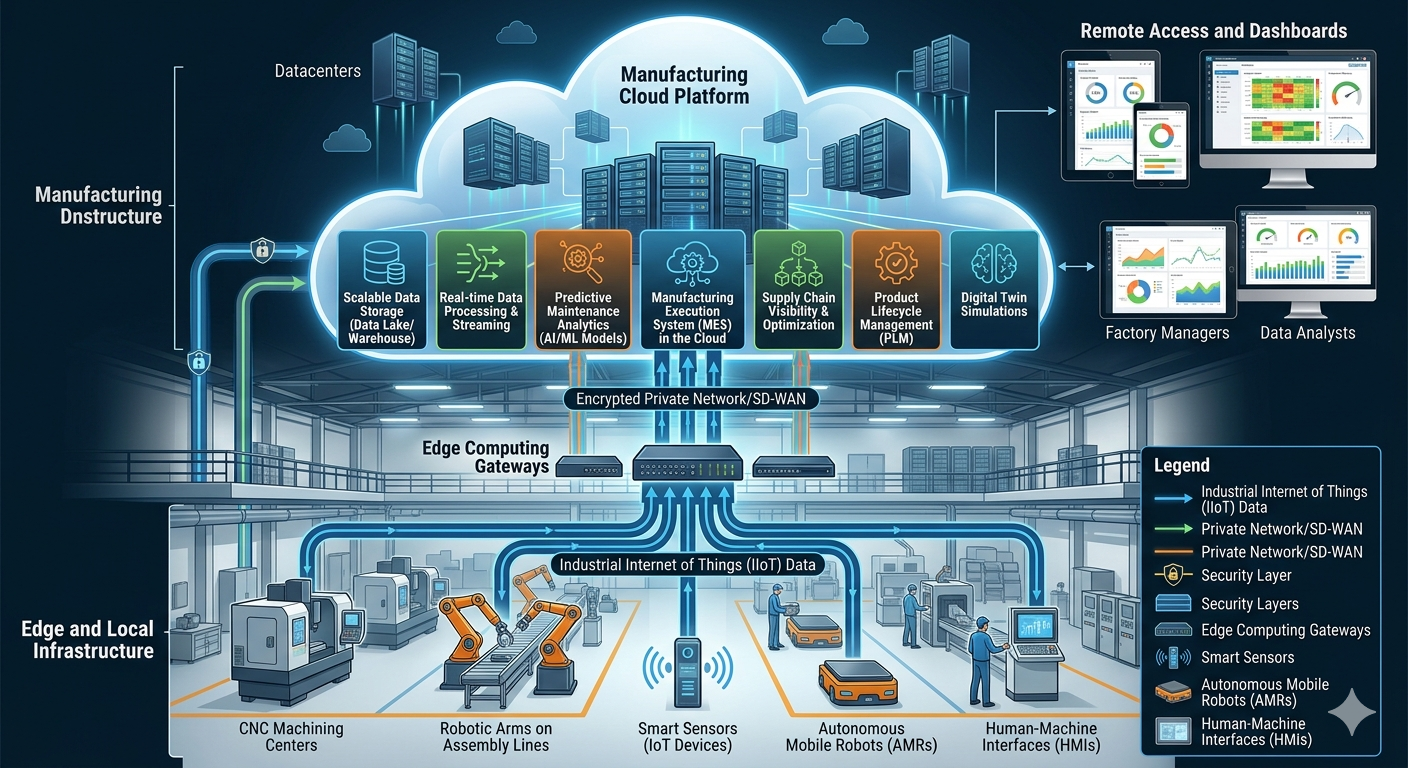
We’re not in the business of prescribing specific software platforms — the right solution depends heavily on your production environment, your ERP landscape, your team’s technical maturity, and your specific operational pain points. What we can describe is what a more mature analytics infrastructure does differently.
Single Source of Truth
Data from the floor, the ERP, the quality system, and the supply chain feeds into one governed, consistent repository. When anyone pulls a number, they’re pulling the same number. The “which version is right” conversation disappears.
Automated Data Collection and Integration
Rather than people manually entering or transferring data between systems, integrations handle movement automatically. Data flows from machines, PLCs, and systems into analytics layers without human handling — which means it arrives faster and with fewer errors.
Real-Time and Near-Real-Time Visibility
Production performance, quality metrics, inventory levels, and equipment status visible on demand — not reconstructed from last week’s exports. Managers and operators can see what’s happening now and respond to it.
Scalable Reporting Architecture
Adding a new line, facility, or product category extends the same reporting infrastructure rather than requiring someone to manually build new workbooks. The data model scales with the business.
How to Have This Conversation Internally
If you’ve read this far and recognize your operation in more than a few of these signs, the challenge is often less about knowing what to do and more about building the internal case for change. A few principles that tend to work:
Quantify the labor cost first. Ask your team to log, for two weeks, how much time they spend on data management activities that don’t involve actual analysis. The number is almost always surprising to leadership and creates a concrete, dollar-denominated starting point for the conversation.
Find your most recent data-related failure. Whether it was an inventory discrepancy, a report that took a week to pull together for a board meeting, or a quality issue that wasn’t caught in time — use a real, recent example as the anchor for the conversation. Abstract arguments about “data maturity” don’t move people the way specific failures do.
Frame it as a growth constraint, not a technology upgrade. The question isn’t “should we buy new software?” The question is “what is our current data infrastructure preventing us from doing, and what does that cost us?” That framing gets leadership attention in a way that IT conversations often don’t.
Start with a diagnostic, not a purchase order. Before any technology decision, a structured assessment of your current data flows, pain points, and requirements will save significant time and money downstream. Understanding the problem thoroughly is more valuable than moving fast to a solution.
The Bottom Line
Excel is not your problem. The assumption that Excel is still the right infrastructure for where your business is today — that’s the problem worth examining.
The manufacturers who build durable operational advantage do it through better visibility, faster decision-making, and the ability to identify improvement opportunities before they become losses. None of that is accessible when your data team is spending their mornings reconstructing last week.
If you recognized your operation in these pages, you’re not alone — and the gap between where you are and where a better analytics foundation could take you is almost always smaller than it looks from the outside.
Not sure where your operation stands?
We offer a no-obligation operational data assessment for manufacturing businesses — a structured look at your current data flows, reporting architecture, and where the highest-value opportunities for improvement exist. Get in touch to get started on generating more insights & making better decisions for your business.