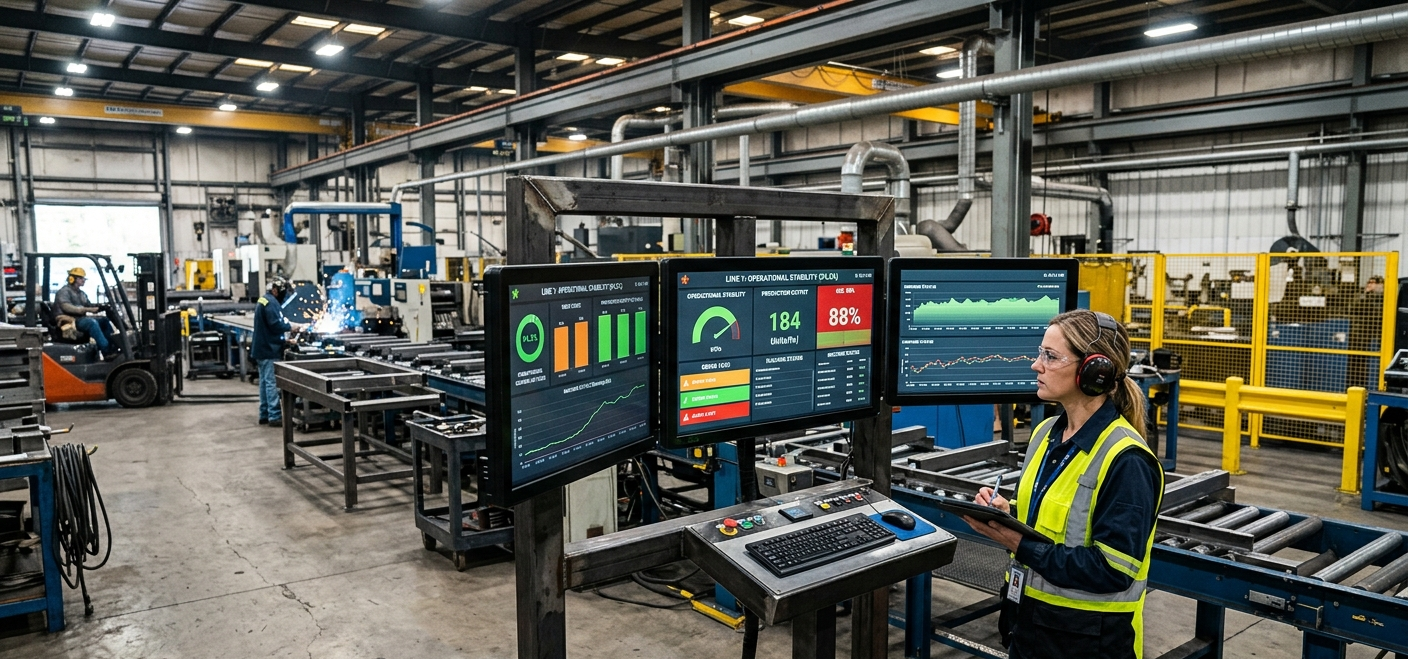
You did it. Three months ago, you deployed a real-time OEE dashboard on Line 4. Uptime improved. Scrap dropped. The plant manager is happy. Now leadership wants to know: can we do this everywhere?
This is where most analytics programs hit a wall. The skills, tools, and relationships that made your pilot successful are often poorly suited to the demands of enterprise scale. Replicating a single dashboard is a technology problem. Scaling a decision-making culture is an organizational one.
After helping manufacturers across discrete, process, and hybrid environments make this transition, we’ve mapped the failure modes — and the practices that overcome them.
Why Pilots Stall
The graveyard of manufacturing analytics is filled with successful pilots. Success, paradoxically, can be the enemy of scale. When a pilot works, organizations often assume the path forward is simply to repeat what they did — assign the same team, use the same tools, and expand the scope.
This assumption almost always fails. Pilots succeed because of exceptional constraint: a single line, a small dedicated team, a motivated champion, and a narrow problem set. None of those conditions survive contact with enterprise deployment.
The Five Common Failure Modes
- The Handoff Problem
Pilot dashboards are often built for the people who built them. When ownership transfers to plant operations, the mental model doesn’t transfer with it. Operators don’t know what questions the dashboard is supposed to answer — or why.
- Data Infrastructure Debt
Pilots often run on custom data pulls, manual feeds, or one-off historian exports. These workarounds are invisible at small scale. At enterprise scale, they collapse under their own weight.
- Governance Vacuum
Who owns the KPI definitions? Who approves changes to the dashboard? Who resolves disputes when Line 4’s OEE number differs from what the ERP reports? Without answers, trust erodes fast.
- Change Fatigue
Plant teams are being asked to absorb new tools constantly. If a dashboard program feels like something done to them rather than for them, adoption stalls — regardless of how good the interface is.
- No Clear Owner
Pilots are owned by the project team. Enterprise programs need a permanent owner with budget authority, cross-functional relationships, and a mandate that doesn’t expire after go-live.
The Scaling Framework
Successful enterprise rollouts share a common architecture, regardless of plant size, industry segment, or technology stack. The framework has four stages — and critically, each stage must be completed, not merely started, before the next begins.
Stage 1: Industrialize the Pilot
Before expanding to new sites, go back and harden what you built. This is the step most organizations skip — and the one they most regret skipping.
Industrializing means replacing every manual workaround with an automated, documented, and supportable process. It means documenting every KPI definition in a data dictionary that lives outside the heads of your analytics team. It means establishing a deployment runbook that a new plant IT team could execute without the original project team present.
Stage 2: Build the Backbone
Enterprise dashboards need enterprise-grade data infrastructure. This doesn’t necessarily mean replacing your historian or ERP — but it does mean establishing a data layer that can serve multiple sites consistently.
At minimum, this backbone should include: a unified tag naming convention, a contextualization layer that maps raw PLC signals to business-meaningful metrics, a defined refresh cadency for each data source, and a monitoring process that alerts on data quality failures before users notice them.
The backbone is not glamorous work. It rarely generates compelling slide material for executive reviews. But every high-performing enterprise analytics program we’ve observed is built on one — and every program in crisis is missing one.
Stage 3: Codify the Adoption Model
Technology is the easy part. Behavioral change is the hard part. Before rolling out to new sites, document exactly how you intend to drive adoption — and be specific enough that a plant manager in a different time zone could execute it without your team present.
Your adoption model should answer: Who receives which dashboard, at what role level? What daily or weekly operating cadences incorporate the dashboard? How are new users onboarded? What does “good” usage look like, and how is it measured? Who handles questions and issues at the plant level?
The answers will vary by site and role — a shift supervisor’s relationship with a production dashboard is entirely different from an engineering manager’s. Design for both.
Stage 4: Govern for the Long Term
Enterprise dashboard programs generate ongoing change requests, data disputes, and enhancement backlogs. Without a governance structure to manage these, programs slowly degrade as individual plants customize their way into incompatibility and IT teams tire of supporting undocumented changes.
Effective governance doesn’t require bureaucracy. It requires clarity: who can request a change, how requests are prioritized, who approves KPI definition changes, and how those changes are communicated across sites. A lightweight Center of Excellence model, even if it’s initially two people, creates the coordination mechanism that prevents entropy.
The Role Taxonomy
One of the most consistent mistakes in enterprise rollouts is treating all dashboard users as equivalent. In practice, a well-scaled program serves at least four distinct user segments — each with different information needs, different decision cycles, and different definitions of value.
Operators: Real-Time Awareness
Operators need to know: Is the line running? Are we on pace? What’s the current reject rate? Their dashboards should be high-contrast, scannable from a distance, and updated at machine speed. They should never require a user to click more than twice to get to actionable information. Complexity is the enemy here.
Shift Supervisors: Exception Management
Supervisors need to surface problems before they become production losses. Their dashboards should highlight deviations from standard, show trends across the shift, and enable rapid drill-down into root cause. Mobile accessibility matters here — supervisors aren’t sitting at a desk.
Engineering & Maintenance: Pattern Recognition
Engineers need historical depth. They’re investigating recurring downtime events, optimizing changeover sequences, and building the case for capital investments. Their dashboards should allow flexible time horizon selection, support export to standard analysis tools, and include enough raw-signal access to validate their hypotheses.
Plant & Operations Leadership: Performance Accountability
Leaders need a single reliable number for each plant, week over week, so they can have informed conversations with site managers. Reliability is more important than granularity here. If leadership can’t trust that the numbers are consistent and current, they’ll revert to manual reporting — and the program loses its executive mandate.
Measuring Program Health
A scaled dashboard program is a living system. It requires active monitoring — not just of the machines it instruments, but of the program itself. Organizations that treat the go-live as the finish line consistently see adoption decay within 12 months.
We recommend tracking three categories of program health metrics on a monthly basis:
Usage Metrics
Active users by role and site, session frequency, average session duration, and feature utilization. Usage drops are early warning signals — they almost always precede trust breakdowns or data quality issues.
Data Quality Metrics
Source system uptime, data freshness by tag, and anomaly detection rates. Every dashboard has a data supply chain. Like any supply chain, it needs to be monitored for failures upstream of the finished product.
Business Impact Metrics
This is the metric that justifies continued investment. It requires establishing a baseline before deployment, defining specific KPIs the program is intended to influence, and tracking those KPIs rigorously at the site level. Correlating improvements to dashboard adoption — while controlling for confounding variables — is difficult work, but it’s the only way to defend the program budget when priorities shift.
The People Equation
Technology accounts for perhaps 30% of what determines whether a manufacturing analytics program scales successfully. The other 70% is organizational — how people are engaged, trained, and motivated to change how they work.
The most powerful adoption mechanism we’ve observed isn’t training sessions or executive mandates. It’s social proof: a respected peer on the floor who uses the dashboard, talks about what it showed them, and connects colleagues to specific decisions they’ve made differently as a result. Identifying and cultivating these “analytics champions” at every site is worth more than any amount of formal change management documentation.
Equally important is what happens when the dashboard is wrong. And it will be wrong — data quality issues, sensor failures, and calculation bugs are inevitable. Organizations that respond quickly, communicate transparently, and fix problems visibly build the trust that sustains long-term adoption. Organizations that go silent, deflect blame, or leave inaccurate data on screen for weeks teach users exactly one lesson: don’t trust the dashboard.
Scale a dashboard program well, and you’re not just scaling software. You’re scaling a new operating model — one where decisions at every level of the organization are anchored in shared, reliable, real-time data. That’s the transformation that manufacturing leaders are actually looking for. The dashboards are just how you get there.