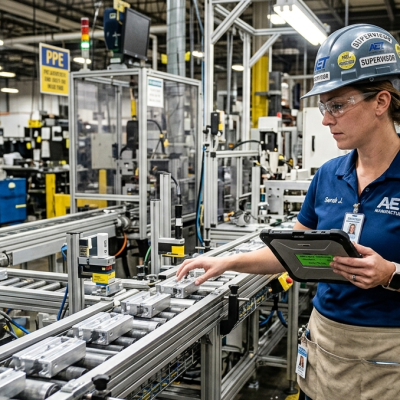
Walk onto the floor of a typical manufacturing plant and ask the shift supervisor how the line is performing. Chances are, they’ll glance at a whiteboard, flip through a clipboard, and give you a number pulled partly from instinct. That number is wrong — not because the supervisor is careless, but because the systems in place were never built to capture the full picture.
Most factories still run on a combination of manual logs, operator-estimated downtime, and spreadsheets assembled hours or days after the fact. The result is an incomplete view of performance: major breakdowns get recorded, but the dozens of small interruptions, brief hesitations, and sluggish cycles that accumulate throughout every shift go largely untracked. Those invisible losses are where real capacity disappears.
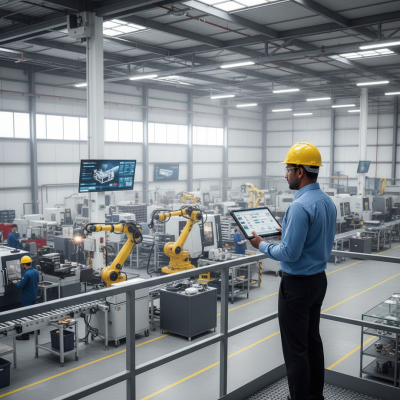
Digitization changes this equation entirely. By connecting machines directly to data infrastructure, plants gain something they’ve never had before: real-time visibility into everything that happens on the line — and the ability to act on it before hours of productivity vanish.
Life in a Non-Digitized Factory
In a traditional plant, downtime reporting is a retrospective exercise. An operator notices a machine has stopped, notes the time manually, and logs a reason — if they remember to log it at all. By end of shift, a supervisor compiles reports that are, at best, a rough approximation of what actually happened. At worst, they’re a sanitized narrative that undersells losses and overstates performance.
Paper-based and delayed reporting systems create several predictable blind spots. Major breakdowns — when a line goes down for 30 minutes or more — tend to get captured. But the small stuff doesn’t. A machine that hesitates every few cycles for 15 seconds. A conveyor that stalls briefly and restarts. A sensor trip that causes a brief pause. None of these are dramatic enough to interrupt a busy operator’s attention, yet collectively they can consume 20% of production time.
The most damaging consequence of manual tracking isn’t inaccuracy — it’s the normalization of loss. When slow cycles aren’t measured, they become the baseline. When micro-stops aren’t counted, they’re assumed to be unavoidable. Over time, hidden inefficiencies get baked into production plans, capacity estimates, and staffing decisions. The organization optimizes around a false reality.
Why OEE Alone Isn't Enough
Overall Equipment Effectiveness has become the standard language of manufacturing performance — and for good reason. As a composite metric of availability, performance, and quality, OEE captures the three dimensions of production loss in a single number. But OEE is only as good as the data feeding it.
In manual environments, the inputs to OEE are compromised before any calculation happens. Availability figures miss the micro-stoppages operators didn’t log. Performance scores don’t reflect the cumulative drag of machines running five or ten percent below ideal cycle time. The metric looks acceptable on the dashboard while the floor bleeds capacity quietly.
The OEE Gap
- Manual environments systematically underreport micro-stoppages — stops under 5 minutes rarely make it into logs.
- Performance losses from slow cycles are invisible without machine-level cycle time data to compare against standards.
- OEE reported from operator estimates can diverge from reality by 15–25 percentage points.
- Without granular event data, Pareto analysis of losses is impossible — every “improvement” is a guess.
Hidden Downtime: The Largest Untapped Opportunity
Micro-stops. Slow cycles. Brief interruptions that last 10, 30, 90 seconds. Individually, they feel insignificant. Cumulatively, they are often the single largest source of lost production in a plant — and they are completely invisible without machine-level telemetry.
Consider a production line running 20 hours per day. If that line experiences an average of one 45-second micro-stop every four minutes — something that might not even register with operators — it loses over four hours of productive time daily. That’s more than many scheduled maintenance windows, and it’s happening silently, every shift, every week.
This is why hidden downtime isn’t just a problem to solve — it’s the business case for the entire digitization investment. It’s the place where the gap between what manufacturers think is happening and what’s actually happening is widest. Closing that gap requires one thing: machine-level data, captured automatically, in real time.
Five Steps from Connected Machine to Actionable Insight
PLC integration via OPC-UA or Modbus for modern equipment. IoT gateways and sensor retrofits for legacy machines. The goal: capture machine states, cycle signals, and timestamps without modifying control systems.
Edge computing for local signal processing and buffering. Real-time ingestion pipelines (MQTT, Kafka). Time-series storage or a data lake. Stream and batch analytics layers feeding live dashboards.
Raw signals become structured events: Running, Idle, Blocked, Faulted, Micro-Stop. Logic detects state transitions via cycle gaps and thresholds. The output is consistent, structured event data — the foundation for everything above it.
Algorithms replace manual logging: cycle time deviation analysis flags cycles running over standard, while gap detection catches missed signals between cycles. The result is a high-frequency, timestamped log of every interruption — events that would never surface in a manual system.
Micro-stop frequency, Pareto-ranked losses, and shift-level comparisons point to root causes rather than symptoms. Advanced layers add predictive models and anomaly detection. Insights feed directly into daily ops briefings, maintenance scheduling, and operator coaching.
What Changes — Before and After
| Dimension | Before Digitization | After Digitization |
|---|---|---|
| Downtime Tracking | Manual logs, operator estimates, major events only | Automated, timestamped, every event captured at machine level |
| Visibility | Retrospective, incomplete, shift-level granularity | Real-time, comprehensive, second-level granularity |
| Micro-Stops | Invisible — not captured in any system | Detected algorithmically; thousands of events surfaced per day |
| Decision Basis | Intuition, experience, anecdote | Data-driven, Pareto-prioritized, evidence-backed |
| Root Cause | Days or weeks to trace issues back to source | Hours; correlated event data points directly to causes |
| Maintenance | Reactive — respond after failure | Predictive — intervene before failure, based on signatures |
| OEE Accuracy | Misleadingly high; misses performance losses | Accurate; reflects true operational performance |
The cumulative effect of these changes is measurable and significant. Plants that successfully digitize and act on the resulting data consistently see throughput improvements in the 5–15% range — without adding capacity, headcount, or capital equipment. The gains come from recovering time that was always available, but never visible.
A Practical Implementation Roadmap
The most common mistake in industrial digitization is trying to do everything at once. The right approach is staged: prove value on a single line, then expand with the confidence of demonstrated ROI behind you.
Pick one production line. Connect machines, deploy the telemetry stack, and focus entirely on surfacing hidden downtime. Quantify the losses. Build the internal business case for broader rollout.
Extend connectivity across the facility. Standardize machine state definitions and event taxonomies. Build plant-wide dashboards. Begin integrating insights into daily operational rhythms and maintenance workflows.
Layer in advanced analytics — predictive maintenance models, anomaly detection, cross-shift comparative analysis, and SKU-level performance benchmarking. The platform becomes a strategic asset, not just an operational tool.
The pilot phase is critical precisely because it’s focused. Rather than attempting to solve every operational problem simultaneously, it demonstrates in concrete financial terms what becomes possible when machines finally tell you what’s happening. That proof is what earns organizational commitment for the phases that follow.
Connect Machine Telemetry to Cloud Analytics for Downtime Reduction with Lasso
Bridging the gap between legacy shop-floor equipment and modern cloud analytics can feel overwhelming for many manufacturers. That’s where Lasso comes in. As a specialized data analytics consulting firm for small and mid-sized manufacturers, Lasso guides factories through every stage of connecting machine telemetry data into secure, scalable cloud platforms—turning raw signals into powerful insights that directly reduce downtime.
From Shop Floor Signals to Cloud-Ready Data
Lasso starts where most factories actually are: a mix of modern PLCs, legacy machines, and limited IT resources. Our team designs practical data acquisition strategies tailored to your equipment:
- PLC integration using industry standards such as OPC-UA and Modbus for real-time state and cycle data.
- IoT gateways and sensor retrofits for older assets that lack native connectivity.
- Edge processing to clean and buffer signals before they leave the plant floor, ensuring reliability even with intermittent network conditions.
Once data is flowing, Lasso builds robust, end-to-end telemetry pipelines that securely ingest information into the cloud. Using proven technologies like MQTT for lightweight real-time transport and Kafka-style streaming where needed, we create resilient ingestion layers that handle high-frequency machine data without overwhelming your infrastructure.
Secure Cloud Infrastructure Built for Manufacturing
Lasso is a certified partner of Microsoft Azure and Databricks, allowing us to deliver governed, high-performance cloud environments optimized for manufacturing workloads. We implement:
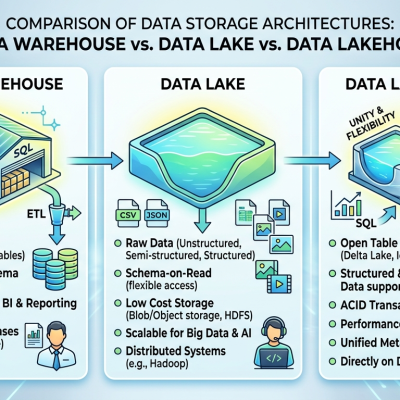
- Lakehouse architectures that combine the flexibility of data lakes with the reliability of warehouses.
- Time-series optimized storage for high-volume telemetry.
- Automated data quality checks and governance so your teams can trust every insight.
This foundation supports everything from real-time dashboards to advanced analytics and machine learning applications—without requiring your internal team to become cloud experts.
Turning Telemetry into Actionable Insights and ML-Powered Outcomes
With clean, connected telemetry in the cloud, Lasso helps you move quickly from visibility to value:
- Automated machine state detection — transforming raw cycle signals and timestamps into standardized events (Running, Idle, Micro-Stop, Faulted, etc.).
- Hidden downtime analytics — using cycle gap detection and deviation algorithms to surface micro-stops and slow cycles that manual systems miss.
- Advanced analytics and ML — building predictive maintenance models, anomaly detection, and root-cause analysis that forecast issues before they cause unplanned downtime.
Our solutions integrate directly into daily operations: real-time alerts for supervisors, automated maintenance work orders, and performance comparisons across shifts, lines, or SKUs. Manufacturers working with Lasso typically see rapid identification of recurring loss patterns, enabling targeted interventions that reduce both planned and unplanned downtime.
Practical Support Every Step of the Way
Lasso doesn’t just deliver technology—we deliver results with your team. Our engagement model includes:
- Strategy workshops to align data efforts with your biggest downtime and throughput opportunities.
- Phased implementation (starting with a single pilot line to prove ROI fast).
- Hands-on training and knowledge transfer so your operators and engineers can own the system long-term.
- Ongoing managed services and optimization as your needs evolve.
Because we specialize in SMB manufacturers, our approach is pragmatic, cost-effective, and focused on quick wins that protect margins and improve efficiency.
By partnering with Lasso, factories replace fragmented manual tracking with a unified, cloud-powered analytics platform—one that continuously uncovers hidden losses and powers smarter decisions. The outcome is measurable: reduced downtime, higher throughput, and a data-driven culture that compounds over time.