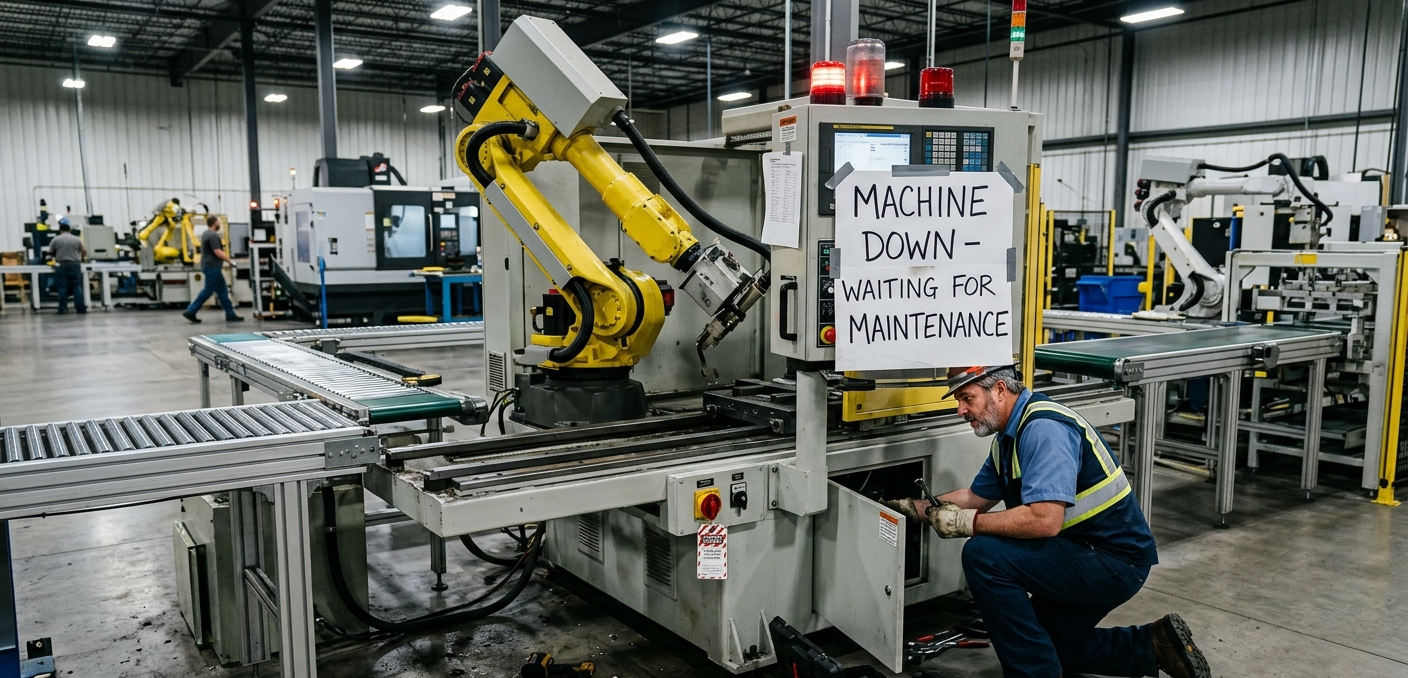
Every minute a machine sits idle, your plant is bleeding money. Unplanned downtime costs manufacturers an estimated $50 billion annually across industries — and yet, in most facilities we visit, the root causes are entirely preventable. The difference between plants that consistently hit 85%+ OEE and those stuck in the 50–60% range isn’t better machines or bigger budgets. It’s visibility.
Real-time OEE dashboards are the single most impactful tool we implement for our clients. This article explains how they work, why they work, and exactly how to use them to drive downtime out of your operation.
What OEE Actually Measures (And Why Most Plants Get It Wrong)
Overall Equipment Effectiveness is a composite metric that multiplies three factors:
OEE = Availability × Performance × Quality
- Availability captures lost time from breakdowns, changeovers, and unplanned stops
- Performance captures speed losses — running slower than ideal cycle time
- Quality captures defect and rework losses
A world-class OEE score is considered 85%. The average manufacturer runs at roughly 60%. That 25-point gap represents an enormous amount of recoverable capacity sitting on your floor right now.
Where most plants go wrong is treating OEE as a lagging metric — something calculated at the end of a shift or a week and reported in a Monday morning meeting. By then, the downtime has already happened, the opportunity to intervene is gone, and the discussion devolves into assigning blame rather than solving problems. Real-time OEE flips this entirely.
The Case for Real-Time: From Reactive to Predictive
When we conduct our initial assessments, we typically find that plant personnel already know which machines have problems. The maintenance supervisor can tell you exactly which line trips most often. The shift leader knows when changeovers run long. The problem isn’t awareness — it’s response latency.
Without real-time data, the typical downtime response cycle looks like this:
Machine stops
Operator notices (1–5 minutes)
Operator contacts supervisor (2–10 minutes)
Supervisor dispatches maintenance (5–20 minutes)
Maintenance diagnoses and repairs (varies widely)
In a well-instrumented plant with a live OEE dashboard, steps 1 through 3 compress dramatically — or disappear entirely. The dashboard flags the stop the moment it occurs, escalation rules fire automatically, and the right person gets a notification before the operator has finished logging the event manually.
Across clients where we’ve implemented real-time monitoring, mean time to respond (MTTR) drops 30–60% within the first quarter. That alone — faster response, not better machines — moves OEE meaningfully.
What a Real-Time OEE Dashboard Should Actually Show
Not all OEE dashboards are created equal. We’ve seen sophisticated SCADA systems displaying data that operators couldn’t act on, and we’ve seen simple shop-floor displays that transformed maintenance behavior overnight. The difference is in the design.
An effective real-time OEE dashboard has four layers of information:
1. The Plant-Level View
A single-screen overview showing current OEE by line, color-coded to threshold. Green (on target), amber (degraded), red (stopped or critically low). This is the view for plant managers and production supervisors — it answers “where do I need to be right now?” in under three seconds.
2. The Line-Level View
Drilling into a specific line, you need to see: current availability, performance, and quality scores in real time; a waterfall or Pareto chart showing where losses are occurring; and a live event log of stops with timestamps and duration. This is the operating layer — it tells supervisors and maintenance leads what is happening and where to focus.
3. The Stop Event Detail
Every unplanned stop should be categorized — by equipment, failure mode, and responsible department — ideally with prompts for the operator to log the reason code. This is where the analytical value lives. Over time, reason code data builds the picture of your top downtime contributors, which is the foundation for all structured improvement work (SMED, TPM, RCA).
4. Trend and Pattern Analysis
A real-time dashboard should also surface historical patterns alongside live data. If a machine typically fails between hours 3 and 4 of a shift, or if performance degrades predictably on Mondays after weekend shutdowns, operators and maintenance teams need to see this. Embedding trend context into the live view transforms reactive monitoring into anticipatory management.
Five Ways Clients Use Real-Time OEE Dashboards to Cut Downtime
1. Automated Escalation and Alerting
The most immediate win. Configure threshold-based alerts so that when a machine goes down, a text or push notification reaches the right maintenance technician within 60 seconds — not after the supervisor notices, not after a radio call chain. One client in automotive components reduced average response time from 18 minutes to 4 minutes on their highest-volume line. At their throughput rate, that difference alone recovered over $800,000 in annual output.
2. Micro-Stop Identification
Micro-stops — brief interruptions of 30 seconds to 2 minutes — rarely show up on manual downtime logs. Operators don’t bother recording them; supervisors don’t catch them. But in aggregate, they can account for 10–20% of lost availability. A real-time dashboard connected to machine sensors captures every micro-stop automatically. When clients see their first micro-stop Pareto report, the reaction is almost always the same: disbelief, then urgency.
3. Changeover Benchmarking and SMED
Changeover time is one of the highest-leverage, most controllable sources of downtime. Real-time OEE dashboards let you timestamp every changeover automatically and compare actual duration against target for every product-to-product transition. Over a few weeks, you build a rich dataset for SMED (Single-Minute Exchange of Die) analysis — which changeovers consistently run long, which operators execute faster, which sequence of steps drives variability. SMED projects informed by live data produce 30–50% changeover reductions routinely.
4. Shift Handover Quality
One of the most underappreciated sources of performance degradation is poor shift handover. When the outgoing team doesn’t communicate machine state, recent anomalies, or pending maintenance items, the incoming team loses 15–30 minutes just reorienting. A dashboard with a live event log and shift-summary screen gives incoming supervisors an instant, objective picture of exactly what happened over the last 8 hours — eliminating the information gap that causes early-shift performance dips.
5. Maintenance Work Order Prioritization
Connecting OEE data to your CMMS (Computerized Maintenance Management System) allows maintenance managers to prioritize work orders by actual operational impact rather than by who submitted them loudest. When a machine’s availability trend line is declining and it’s flagged as a high-throughput constraint, that drives scheduling decisions with data. Plants that integrate OEE dashboards with their CMMS see measurable reductions in both reactive maintenance spend and equipment failure frequency within 6–12 months.
Implementation: What It Actually Takes
A question we get constantly: Do we need to replace our existing equipment?
Almost never. Modern OEE platforms connect to PLCs, sensors, and SCADA systems via standard protocols (OPC-UA, MQTT, Modbus). In most cases, the machines already generating the data you need — it’s simply not being captured and surfaced in a useful way. Edge gateways can pull data from legacy equipment that lacks native connectivity.
A typical implementation for a mid-sized plant with 10–20 production lines follows this arc:
Weeks 1–2: Assessment and data architecture. We audit existing machine connectivity, identify data gaps, and define the KPI framework — which metrics matter for your specific operation, what thresholds constitute “normal,” and what escalation logic makes sense.
Weeks 3–6: Infrastructure and integration. Edge hardware deployed where needed, connections to PLCs and sensors established, data pipeline to the OEE platform validated. Operator reason-code interfaces configured on the shop floor.
Weeks 7–8: Dashboard configuration and user training. Dashboards built for each user level (operator, supervisor, plant manager, maintenance). Alert routing configured. Training delivered — critically, focused not just on “how to use the software” but “how to respond to what you see.”
Week 9+: Continuous improvement cycle. The dashboard is the beginning, not the end. We establish a weekly OEE review cadence for the first 90 days, driving structured response to top loss categories. This is where the real gains accumulate.
The Number That Matters Most
When clients ask us what kind of ROI to expect, we use a straightforward model: every 1-point increase in OEE on a production line is worth roughly 1% of that line’s theoretical annual output — recaptured as real throughput or reduced overtime. For a line with a replacement value of $5M and a current OEE of 65%, moving to 75% represents $500,000 or more in annual value, depending on product margins.
Most of our clients recover the full cost of implementation — hardware, software, and consulting — within 6 to 9 months. The few who don’t are typically in industries with very low product margins or very low-volume, high-mix operations where other constraints dominate before equipment effectiveness becomes the binding limit.
Getting Started
If you’re running OEE calculations manually, or receiving reports a day or more after the fact, you’re managing downtime from the wrong side of the problem. The data you need to prevent most of your unplanned stops already exists in your machines. The question is whether you’re surfacing it in time to act.
A real-time OEE dashboard won’t solve every problem in your plant. But it will tell you exactly which problems to solve first — and give your people the information they need to solve them faster.
Lasso specializes in manufacturing analytics and operational intelligence for discrete and process manufacturers. Our team has implemented real-time OEE programs across automotive, food & beverage, consumer goods, and industrial equipment sectors. To schedule an assessment of your current OEE infrastructure, contact us today.