There’s a conversation we have with nearly every new client that goes something like this: a plant manager from a pharmaceutical company calls us after sitting through a demo of an analytics platform built for an automotive OEM. “It looked impressive,” they say, “but none of it seemed to apply to us.” They’re right — and the reason goes deeper than software features. It comes down to a fundamental difference in how discrete and process manufacturing work, and therefore how analytics must be designed to deliver value in each.
After years of building analytics solutions across both manufacturing paradigms, we’ve learned that applying the wrong mental model is one of the most expensive mistakes an organization can make. This article explains why.
The Core Distinction: What Are You Making, and How?
Before diving into analytics, it helps to ground the conversation in operations.
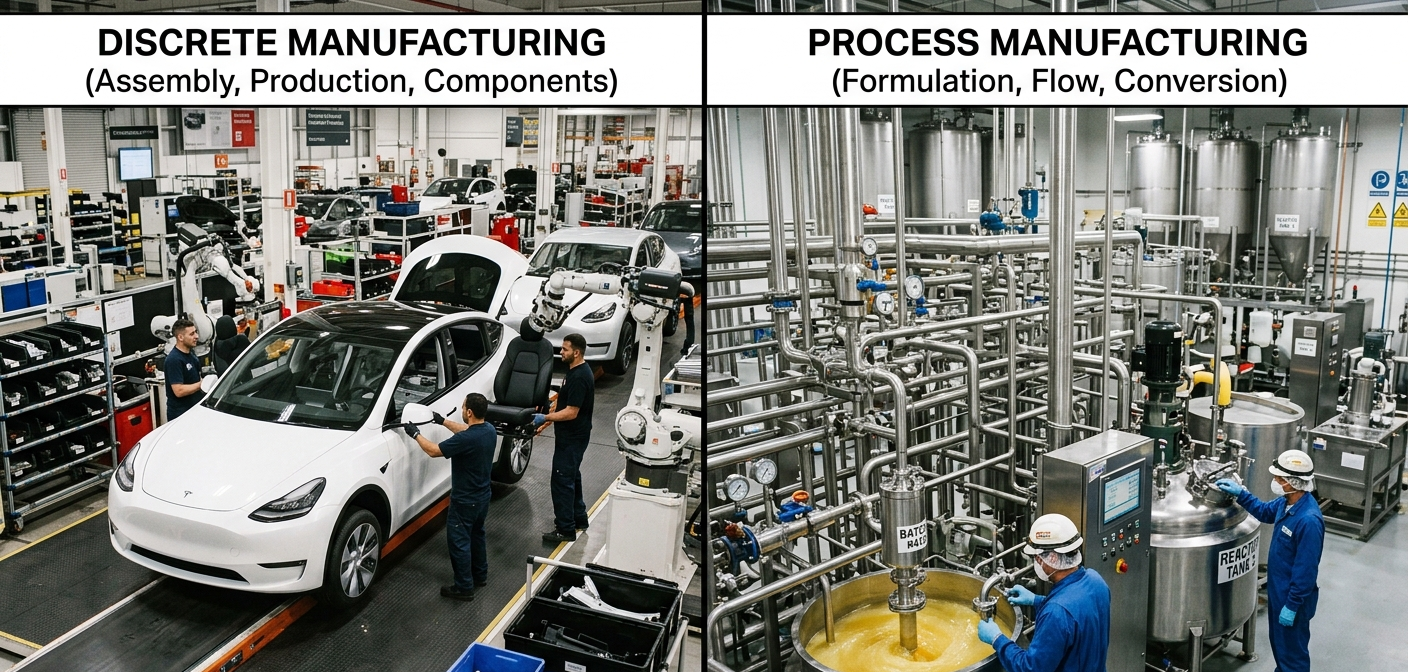
Discrete manufacturing produces distinct, countable units — cars, circuit boards, medical devices, appliances. Each unit can theoretically be tracked from raw material to finished good. The production process is often assembly-based, with clear work orders, BOMs (bills of materials), routings, and defined operations at each workstation. You can pick up the product, inspect it individually, and rework or reject it as a single unit.
Process manufacturing converts raw materials into products through chemical, biological, or physical transformation — refining crude oil, brewing beer, mixing paint, producing API compounds. The output is typically measured in volume, weight, or batch quantity rather than individual units. Once you’ve blended, reacted, or extruded a batch, you generally cannot “un-make” it. Rework is rare; yield loss is the cost of doing business.
These aren’t just operational differences. They reshape what questions analytics can answer, what data is available to work with, and what “good performance” even means.
How the Data Looks Different
In Discrete Manufacturing
Data tends to be event-driven and transactional. A part enters a workstation, an operation is performed, a scan or sensor registers the event. MES systems capture cycle times, downtime events, defect codes, and WIP movements. The grain of analysis is typically the unit or work order.
Key data characteristics:
- High cardinality of SKUs and part numbers
- Rich genealogy and traceability data (serial/lot linkages)
- Downtime and OEE data tied to specific assets and shifts
- Quality data at the unit or batch level with defined pass/fail criteria
In Process Manufacturing
Data tends to be continuous and time-series in nature. Sensors capture temperature, pressure, flow rate, pH, viscosity — often at sub-second intervals across hundreds of tags. A single batch may generate millions of data points across a campaign that runs for days. The challenge isn’t collecting data; it’s knowing which of the thousands of process variables actually matter for yield, quality, and throughput.
Key data characteristics:
- High-frequency time-series from historians (OSIsoft PI, Aspentech IP.21, etc.)
- Batch records with phase-level process data
- Continuous process streams where “unit” boundaries are ambiguous
- Quality outcomes measured at the end of a batch, not in real time
Why Your Analytics Strategy Has to Reflect This
1. The Unit of Analysis Is Fundamentally Different
In discrete manufacturing, the work order or serialized unit is the natural anchor for analysis. You can ask: “Which product lines have the highest first-pass yield?” or “Which operators produce the fewest defects?” The data lines up neatly.
In process manufacturing, the batch or production campaign is the unit — and even that gets complicated. Continuous processes like refining or utilities may have no natural batch boundary at all. Analytics built around discrete units will simply fail to execute against this data structure. We’ve seen companies spend months trying to force-fit a discrete OEE model onto a continuous chemical process, generating metrics that operators correctly recognize as meaningless.
2. OEE Means Something Different — or Doesn’t Apply at All
Overall Equipment Effectiveness is one of the most widely deployed manufacturing KPIs in the world, and for good reason in discrete environments. But its assumptions break down in process manufacturing.
OEE was designed for equipment that cycles — a press that stamps parts, an assembly station with a defined takt time. In a continuous process, what’s the “ideal cycle time” of a distillation column? When a reactor runs at 94% yield instead of 97%, is that a quality loss, a speed loss, or a reflection of raw material variability that no operator could control?
Process manufacturers need metrics like batch cycle time variability, yield per unit of input, energy intensity per ton of output, and process capability indices (Cpk) across critical quality attributes. These require different data models, different calculations, and different thresholds for what constitutes good performance.
3. Root Cause Analysis Requires Different Methods
In discrete manufacturing, root cause analysis often follows a structured path: identify the defective unit, trace its genealogy, look for common factors (same shift, same tool, same supplier lot). The causal pathway is often relatively short and interpretable.
In process manufacturing, root cause is a multivariate problem. Yield losses in a batch reactor may stem from the interaction of a dozen process parameters — inlet temperature, agitation speed, pH drift, catalyst age, ambient humidity — none of which is obviously “the cause” in isolation. This is where multivariate statistical process control (MSPC), principal component analysis, and partial least squares (PLS) regression become essential tools rather than academic exercises.
We consistently find that process manufacturers who try to do root cause analysis with the same pivot-table-and-Pareto approach used in discrete environments end up frustrated. The signal is in the interactions, not the individual variables.
4. Predictive Maintenance Has Different Failure Modes
Predictive maintenance analytics are table stakes in modern discrete manufacturing. Vibration sensors, thermal imaging, and acoustic monitoring on CNC machines and conveyors follow relatively well-understood failure physics. Survival analysis, ARIMA models, and anomaly detection on cyclical equipment have a long track record.
In process manufacturing, equipment degradation is often tied to fouling, corrosion, and catalyst deactivation — phenomena that are slower, harder to instrument directly, and intertwined with process conditions. A heat exchanger’s fouling rate depends on what you’re running through it and at what conditions. Predictive maintenance models here must account for process history and operating regimes, not just equipment age or vibration signatures.
The analytics architecture, feature engineering, and model validation approaches all need to reflect these differences.
5. Real-Time Intervention Windows Are Different
In discrete manufacturing, an alert on a defective part at Station 4 might trigger a rework loop before the unit moves downstream. The intervention window can be seconds or minutes.
In process manufacturing, interventions often happen during a batch campaign — adjusting feed rates, temperature setpoints, or reagent addition to steer a batch back toward target. This requires analytics that can assess batch trajectory in real time against a “golden batch” profile and flag divergence before it’s too late to correct. After the batch is done, the only lever is the next one.
This real-time, in-campaign analytics capability requires time-series infrastructure, low-latency data pipelines, and models designed around batch phasing — none of which are needed in the same way for discrete shop floor control.
Where We See Organizations Go Wrong
Buying a platform designed for one paradigm and deploying it in the other. Many of the major MES and analytics platforms on the market were built with a primary manufacturing type in mind. Features that don’t fit get bolted on later. When a pharma client asks their discrete-first platform vendor for batch analytics, the answer is often a dashboard that superficially resembles what they need but doesn’t reflect the underlying data correctly.
Hiring analytics talent without manufacturing domain expertise. A data scientist who is excellent at building classification models may not understand the physical chemistry of a crystallization process, what process variable interactions matter, or why a model that backtests well in a lab environment fails when deployed on the plant floor. Domain-grounded analytics talent is harder to find and worth prioritizing.
Standardizing on one analytics approach across a mixed portfolio. Many large manufacturers have both discrete and process operations — a consumer goods company might run discrete packaging lines alongside continuous mixing operations. The impulse to standardize on a single analytics framework is understandable from a cost and governance perspective, but it often produces a lowest-common-denominator solution that serves neither operation well. A federated approach, with shared data infrastructure but differentiated analytics layers, typically performs better.
The Right Starting Point
When we engage with a new manufacturing analytics client, one of the first things we establish is which paradigm — or combination — we’re working in. That determination drives everything: data architecture decisions, KPI design, model selection, deployment strategy, and change management approach.
Process manufacturers shouldn’t assume that because an analytics solution works brilliantly at a discrete automotive plant, it will translate to their specialty chemicals facility. And discrete manufacturers shouldn’t underestimate the complexity of a process environment just because the output looks simpler.
Manufacturing analytics done right starts with understanding what kind of manufacturing you’re actually doing.
Interested in discussing how analytics can be tailored to your specific manufacturing environment? Contact Lasso to start the conversation.