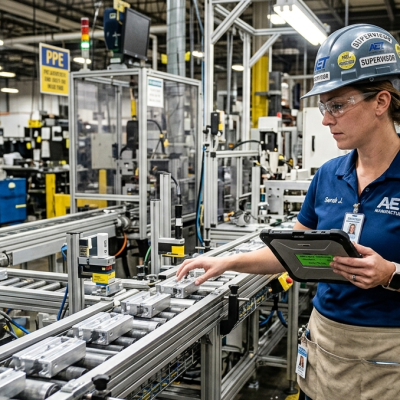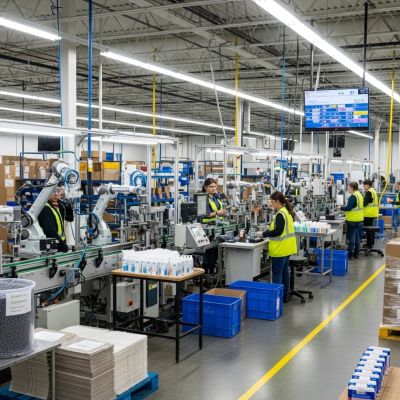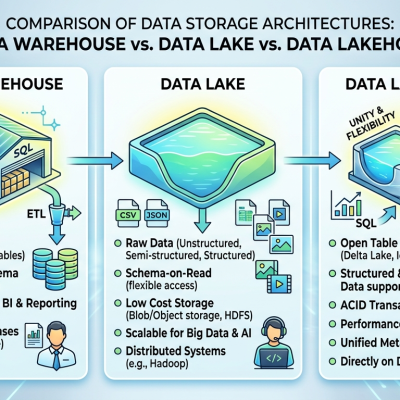

We’ve worked across discrete manufacturing, process industries, and supply chain operations. And the single most common failure mode we encounter isn’t a technology problem. It isn’t a data quality problem. It’s an alignment problem: data initiatives that were built without a clear, traceable line back to what the business actually cares about.
This post lays out the framework we use to help clients build data strategies that don’t just collect and report — but actively drive decisions that move the needle on margin, throughput, quality, and growth.
Why Most Manufacturing Data Strategies Fall Short
Before we get into how to build the right strategy, it’s worth being honest about how the wrong one happens. It usually starts with genuine enthusiasm: the operations team wants better OEE visibility, IT wants to modernize the data stack, and leadership wants a “data-driven culture.” So the company invests in sensors, a historian, maybe a data lake, and a BI tool.
Six months later, they have dashboards. Twelve months later, the dashboards are largely ignored. Two years later, someone proposes rebuilding the whole thing.
The problem isn’t the technology. The problem is that no one stopped to ask: what decisions will this data actually change?
Data that doesn’t connect to a decision is just storage cost. And a strategy that doesn’t connect to a business goal is just a project plan.
The Right Starting Point: Business Goals First, Data Second
The foundational shift we ask every client to make is simple to say and genuinely hard to do: start with the business goal, not the data.
That sounds obvious. In practice, most organizations do it backwards. They inventory what data they have (or could have), then ask what they can do with it. The result is a strategy that reflects their data architecture rather than their business strategy.
The right sequence looks like this:
This sequencing matters enormously. It ensures that every data asset you build has a named decision it supports, a named user who will make that decision, and a named business outcome it connects to. Anything that can’t trace back through that chain is optional at best, noise at worst.
Translating Business Goals into Data Requirements
Let’s make this concrete. Suppose your business goal is to improve gross margin by 2 percentage points over the next 18 months. That’s a P&L objective. How does it become a data strategy?
Step One — Decompose the Goal
Gross margin in manufacturing is driven by a handful of core factors: material cost, labor efficiency, energy consumption, quality yield, and overhead absorption. A cross-functional workshop with finance, operations, and engineering will surface which of these has the most leverage in your specific context. Let’s say yield loss is your primary culprit.
Step Two — Define the Decision Layer
Improving yield isn’t a data problem — it’s a decision problem. Who decides what changes to make, and when? In most plants, you have quality engineers doing root cause analysis, process engineers adjusting recipes or parameters, and production supervisors managing operator behavior. Each needs different information, at a different cadence, in a different format.
The quality engineer needs granular defect data with traceability to upstream process conditions. The process engineer needs statistical process control visibility and correlation analysis across hundreds of parameters. The production supervisor needs a simple, real-time signal: are we in spec or not?
Step Three — Specify the Data Products
Now you can define actual data products — not tables, not feeds, but products with users, use cases, and success criteria:
For the yield example: you might need a real-time SPC monitoring product for the line, a defect traceability product for quality engineers, and a weekly yield variance report that connects process parameters to financial impact for plant leadership. Three products, three users, one business goal.
The Five Pitfalls We See Most Often
Even with the right framework, experienced teams fall into predictable traps. Here are the five we encounter most frequently — and how to sidestep them.
Pitfall 1 — The Data Lake That Becomes a Data Swamp
Collecting everything on the assumption that you’ll figure out what to do with it later is seductive. Storage is cheap. But curation, governance, and interpretation are not. A data lake built without governed domains and clear ownership will decay into an untrusted, unusable mess within 18–24 months. Collect purposefully, not comprehensively.
Pitfall 2 — Optimizing for the Analyst, Not the Operator
The most valuable decisions in manufacturing are made by people on the floor — shift supervisors, process technicians, maintenance leads. These users don’t live in analytics tools. If your data strategy produces outputs that require data literacy to interpret, you’ve built for the wrong audience. The best manufacturing data products are frictionless for the operator and rich for the analyst — not the same product, but designed in concert.
Pitfall 3 — Treating Data Quality as a Prerequisite Instead of a Practice
We regularly hear: “We can’t start until our data is clean.” This is a strategy for never starting. Data quality in manufacturing is an ongoing discipline, not a one-time cleanup project. Build data quality monitoring into your pipelines from day one, establish clear ownership for data quality at the source, and design your analytics products to be transparent about data confidence levels. Waiting for perfect data means waiting forever.
Pitfall 4 — Ignoring the Change Management Dimension
A data strategy is a change management initiative with a technology component — not the other way around. The reason most analytics initiatives fail to sustain adoption isn’t that the technology doesn’t work. It’s that the people who were supposed to change how they work never fully bought in. Involve the end decision-makers in defining requirements. Build feedback loops that let them shape the products they use. Celebrate early wins loudly.
Pitfall 5 — Measuring Activity Instead of Outcomes
Reporting on dashboards built, data sources connected, or users onboarded feels like progress. It isn’t — or at least, it isn’t the right kind. Measure what changes in the business: yield improvement, downtime reduction, quality escape rate, inventory turns. If your data strategy reporting doesn’t include business outcome metrics, you’re measuring the means, not the end.
Building for Scale Without Building Before You're Ready
One of the most common tensions we help clients navigate is the desire to build a “future-proof” data architecture before they’ve validated what they actually need. The result is over-engineered infrastructure that takes 12–18 months to stand up, by which point business priorities have shifted and the architecture is already partially obsolete.
Our recommendation: build in 90-day value cycles. Each cycle should deliver a usable data product tied to a specific business goal, generate feedback from real users, and inform the next cycle’s priorities. This isn’t agile for its own sake — it’s how you maintain the alignment between your data strategy and your business strategy as both evolve.
The platform architecture should enable this iteration, not constrain it. That means modular design, clear data domains with defined ownership, and lightweight governance that can scale without becoming bureaucratic. The goal is an architecture that makes it easy to add new data products, retire obsolete ones, and reorient when the business changes direction.
What a Connected Strategy Actually Looks Like
The best manufacturing data strategies we’ve seen share a few characteristics that are worth naming explicitly.
They have an owner. Not a committee, not a steering group — a named individual who is accountable for the connection between data investment and business outcomes. This is often a VP of Operations or a Chief Digital Officer, but the title matters less than the accountability.
They have a business narrative. Not a technology roadmap, but a story: “We’re investing in data to reduce our cost of poor quality by 30% over two years, by giving our quality and process engineering teams the visibility they need to identify and eliminate systemic defect causes.” That’s a strategy. “We’re building a data lakehouse with a semantic layer and self-service BI” is an architecture plan.
They are reviewed and revised.** Business priorities shift. New competitive pressures emerge. A product line gets discontinued or a new one launches. A data strategy that was built once and reviewed annually will drift out of alignment. The best ones are reviewed quarterly — not to rebuild them, but to confirm that the priority ordering still reflects business reality and adjust where it doesn’t.
They earn trust incrementally. The first data product doesn’t need to be transformational. It needs to be reliable, useful, and fast enough that the person using it starts to trust it. Trust is the currency of adoption, and adoption is what produces business value. Start with a narrow, high-value use case where you can demonstrate clear impact. Let that success open the door to the next one.
Where to Start
If you’re building or rebuilding your manufacturing data strategy, we suggest beginning with a structured alignment workshop — typically two to three half-days — that brings together operations, finance, and technical leadership to complete the goal decomposition exercise outlined above. The output is a prioritized data product backlog, each item linked to a business goal and a decision owner.
From there, select the highest-priority item and build it in 90 days or less. Not a proof of concept — a production-ready product, in use by real decision-makers, with baseline metrics established. Then measure the business impact, learn from the adoption, and use those learnings to define the next 90-day cycle.
It sounds simple because the principle is simple. The discipline required to execute it — especially the discipline to say no to data initiatives that can’t be traced back to a business goal — is where most organizations need support. That’s exactly the kind of work we do.
Manufacturing has never had more data available to it. The companies that win in the next decade won’t be the ones with the most data — they’ll be the ones who built the clearest, most disciplined connection between their data and the decisions that drive their business.
That connection is a strategy. And it’s built on purpose, not by accident.
Ready to Connect Your Data to Your Business Goals?
We work with manufacturing operations teams to design and implement data strategies that move the needle on the metrics that matter most.