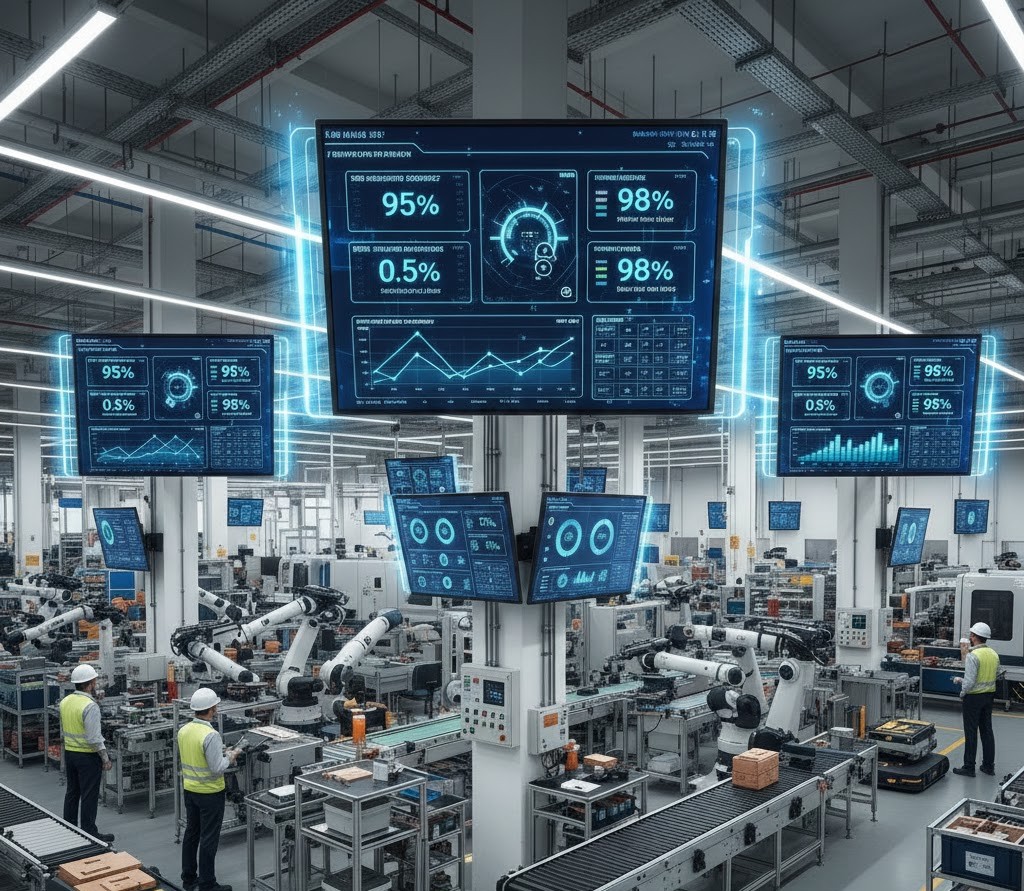
We’ve sat in a lot of plant offices. On one wall there’s a massive monitor showing a live OEE gauge — green, mostly. On the table in front of us, a maintenance manager is flipping through a spreadsheet he built himself, which tells a completely different story. Downtime is being logged in three different systems. Nobody agrees on what “planned maintenance” means for the purpose of the calculation.
The dashboard looks great. The data underneath it is a quiet disaster.
This is the single most common pattern we encounter when a manufacturer calls us after a failed BI implementation. They invested in visualization before they invested in foundation — and now they have beautiful charts built on sand. This post is about how to avoid that mistake.
Why Dashboards Fail (It's Rarely the Dashboard)
Visualization tools — Tableau, Power BI, Grafana, custom React apps — are genuinely mature technology at this point. When a dashboard project fails, the tool is almost never the culprit. The failure is almost always upstream: missing data, inconsistent data, or data that exists but can’t be trusted.
We think of it in three failure modes:
Failure Mode 1 — The Data Doesn’t Exist
You want to track changeover time by product family. Nobody has ever systematically recorded when changeovers start and end. The data simply isn’t there. A dashboard cannot create data that was never captured.
Failure Mode 2 — The Data Exists But Disagrees With Itself
Your ERP says you ran 1,200 units on Line 3 last Tuesday. Your SCADA historian says 1,187. Your operators logged 1,204 on the paper traveler. Which number goes on the dashboard? Which number do you trust in a customer dispute?
Failure Mode 3 — The Data Exists But Nobody Owns It
The data is there, it’s roughly accurate, but there’s no process for maintaining it. Shift codes change and nobody updates the lookup table. A machine gets retired and its ID gets reused. Over six months, the historical data becomes meaningless for trend analysis.
The Four Pillars of a Minimum Viable Data Foundation
Through dozens of manufacturing analytics engagements across discrete, process, and hybrid environments, we’ve distilled the prerequisites into four pillars. All four need to be at least partially in place before a dashboard is worth building. None of them require a massive IT project to get started.
Pillar One — A Single Source of Truth for Each KPI
For every metric you intend to display, there must be one — and only one — system of record. This sounds obvious until you try to enforce it. Which system owns production counts? Which owns scrap? Which owns labor hours? Define it explicitly, document it, and make sure every downstream calculation pulls from that single source. Disagreements between systems should surface as an alert, not get quietly averaged away.
Pillar Two — Consistent Timestamps and Time Zones
Timestamp inconsistency is the silent killer of manufacturing analytics. Your PLC logs in machine time. Your MES logs in server time. Your ERP logs in UTC, converted to local on display — except when it doesn’t. The moment you try to join these datasets, you get phantom production gaps, impossible cycle times, and shift reports that don’t align with shift boundaries. Before any dashboard, audit your time sources and establish a canonical time standard for all operational data.
Pillar Three — Stable, Maintained Master Data
Master data is the scaffolding everything else hangs on: your equipment hierarchy, product master, work center definitions, shift schedules, and downtime reason codes. In most plants we assess, this data exists — but it’s stale, inconsistently used, and has no owner. Downtime codes added years ago and never retired. Equipment IDs duplicated across systems. A machine labeled “Line 2 Press” in one system and “PRESS-002” in another. Stable master data means every transaction in your operational systems can be reliably contextualized.
Pillar Four — Defined Business Rules in Code, Not in Heads
Every plant has institutional knowledge that lives in a few people’s brains: “We don’t count scrap from the first ten parts of a run,” or “Scheduled maintenance doesn’t count against OEE unless it runs over two hours.” These rules are real and legitimate. The problem is when they exist only informally — because the moment you build a dashboard, someone will challenge a number, and your answer cannot be “well, Dave knows how we calculate that.” Business logic belongs in documented, version-controlled transformation code that anyone can inspect.
The Pre-Dashboard Readiness Checklist
Before greenlighting any dashboard build, we run through a structured readiness assessment with every client. The questions below are the ones that reveal real gaps fastest. Work through them honestly. A “no” answer isn’t a blocker — it’s a work order.
Data Capture
- Can you identify the exact system that is the record of truth for each metric you want to display?
- Is production count data captured automatically, or does it rely on manual entry at end of shift?
- Is downtime captured in real time, or reconstructed after the fact from operator memory?
- Are changeovers, setups, and planned maintenance recorded with start and end timestamps?
Data Quality
- Do your production counts in your MES/ERP match your SCADA/historian counts within an acceptable tolerance?
- Is your scrap classification consistent enough to aggregate meaningfully across shifts and lines?
- Are timestamps from different source systems aligned to a single time standard?
- Is there a process for identifying and resolving data anomalies (null values, outliers, duplicate records)?
Master Data
- Is your equipment hierarchy documented and consistent across all operational systems?
- Do all systems use the same identifiers for products, work centers, and resources?
- Is there a named owner for each master data domain who is responsible for keeping it current?
- Are your downtime reason codes actively maintained — and used consistently by operators?
Business Rules
- Are your KPI definitions (OEE, throughput, yield, etc.) written down somewhere everyone agrees on?
- Do all stakeholders who will consume a dashboard agree on how the metrics are calculated?
- Are any manual adjustments or exclusions applied to your data documented as formal rules?
- Is there a process for updating business rules when operational realities change?
What "Good Enough" Actually Looks Like
We want to be careful here: we are not saying your data needs to be perfect before you can build anything. Waiting for perfect data is how analytics projects stall for years. What we’re saying is that each pillar needs to reach a functional threshold — a level at which a dashboard will give you more signal than noise.
A useful way to think about it: can you put a number on a screen and defend it in a room full of skeptical people? If the answer is yes — if you can trace that number back to its source, explain how it was calculated, and identify what would make it wrong — then your foundation is probably sufficient to build on. If the number generates more arguments than insights, you’re not ready yet.
The good news is that building the foundation and building dashboards don’t have to be entirely sequential. We often run them in parallel: begin with a narrow, high-confidence scope — one line, one shift, one metric — where the data is cleanest. Build there, learn from it, and expand as the foundation matures.
Where to Start if You're Starting From Zero
If you’re reading this and thinking “we have almost none of this in place,” here’s the sequence we’d recommend:
First, audit before you build. Spend two to four weeks mapping what data you actually have, where it lives, and what its quality looks like. Don’t assume. We’ve found clients who thought they had a data gap discover they had the data — it just lived in a system nobody remembered to include.
Second, establish your single system-of-record for production counts. Everything else — OEE, throughput, yield — flows from accurate production counts. This is the load-bearing wall. Get this right first.
Third, fix your timestamps. This is often a short technical effort with enormous downstream payoff. Many of the “mysterious” anomalies in manufacturing data evaporate once timestamps are consistently aligned.
Fourth, assign master data ownership. Pick a person for equipment hierarchy, a person for product master, a person for downtime codes. Give each of them a simple governance process — review quarterly, document changes, communicate updates. This is organizational, not technical, and it’s where most data foundations fall apart.
Fifth, write down your KPI definitions. Get all stakeholders in a room. Define OEE. Define yield. Define scrap. Get sign-off. This conversation is uncomfortable, which is exactly why it needs to happen before the dashboard exists — not after, when everyone is pointing at different numbers.
The Bottom Line
Dashboards are not the hard part. They feel like the hard part because they’re visible — you can see them, demo them, point to them in a budget review. The data foundation is invisible, which makes it easy to underinvest in. But every great manufacturing analytics program we’ve ever seen was built on a foundation that someone took seriously before anyone talked about visualizations.
The manufacturers who do this well don’t have more sophisticated tools than anyone else. They have cleaner data, clearer ownership, and less tolerance for the ambiguity that makes numbers untrustworthy.
Get the foundation right. The dashboards will be the easy part.
Not Sure Where Your Foundation Stands?
Before the right dashboard, report, or analytics initiative can deliver value, the data underneath it has to be trustworthy. Most manufacturers we talk to suspect there are gaps — they just don’t know where, or how significant.
That’s exactly what our Data Readiness Assessment is designed to surface.
You’ll leave with a clear picture of where your data is reliable and where it isn’t, a view of the highest-value opportunities your current data can already support, and full alignment across your team on definitions and ownership before any build begins.