

In the competitive world of SMB manufacturing, knowing your metrics is critical to success. With limited resources, tighter margins, and increasing pressure to modernize, tracking the wrong metrics isn’t just inefficient—it’s costly. The right KPIs can sharpen decision-making, align teams, and drive measurable growth. The wrong ones create noise, misalignment, and false confidence. For SMBs, it’s all about identifying the right metrics to monitor and improve upon based on you business goals.
Start with Strategy, Not Benchmarks
The most common mistake is opening an industry report, finding a list of “standard manufacturing KPIs,” and copying them without considering how they fit into your business objectives. As mentioned above, it is all about focusing organizational resources on the right things to drive real business outcomes, not just creating more noise and misalignment across the company.
Before picking a single metric, answer three questions:
What’s the constraint in your business right now? Is it capacity? Cash? Quality? Customer acquisition? The answer shapes everything. A shop with a long backlog and late deliveries needs throughput and schedule adherence metrics. A shop sitting at 60% utilization needs sales and quote conversion metrics. Measuring the wrong thing isn’t neutral — it draws attention away from what actually matters.
What decisions do you make every week? Good KPIs support decisions. If you have a Monday morning production meeting, you need metrics that tell you what happened last week and what to adjust this week. If you review financials monthly, you need metrics that give you a complete picture at that cadence. The metric should fit the decision-making rhythm, not the other way around.
What keeps you up at night? That anxiety is probably pointing at something real. If you’re worried about a key customer leaving, customer satisfaction and on-time delivery deserve a spot on your dashboard. If you’re worried about cash, look at receivables aging and gross margin by product line. KPIs are early warning systems — put them where the risk is.
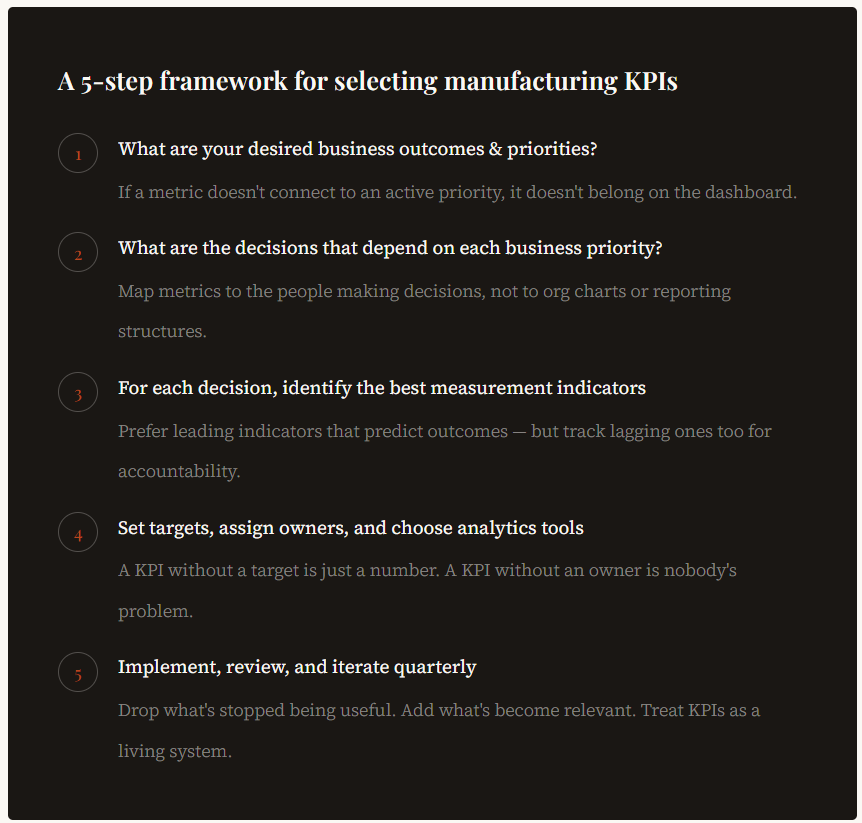
A 5-Step Framework for Selecting KPIs
In this simple framework, we’re going to explore how to build out a data strategy to link operational KPIs to business outcomes and to concrete assignable actions. And beyond the strategic view, we’ll go through how to actually implement this structure on a modern cloud data stack.
Step 1: What are your Desired Business Outcomes & Priorities?
Every KPI decision begins here. Ask: What are we trying to achieve in the next 12–18 months? Before selecting a single KPI, the overall objectives need to be clear.
Are you trying to:
Grow Revenue & acquire new customers?
Increase margins?
Increase throughput without adding headcount
Reduce scrap or rework
Improve on-time delivery
These are important first steps to consider as the implications of choosing one versus could lead to a different selection of KPIs. For exampale, if your goal is to grow revenue and acquire new customers, you might be focused on figuring out how to lower prices, decrease lead times, and improve quality while keeping margins the same. In contrast, you may be satisfied with your revenue, but your margins may be getting squeezed due to inefficiencies across your production processes, whether it be in labor, machinery, scrap or inventory.
The output of this step should be a short list of the top 2-3 business priorities to achieve within the next 12-18 months.
Step 2: What are the Decisions that Depend on each Business Priority?
Who makes the decision? How often? What information do they need to make it well?
A good framework for selecting KPIs based on decisions that need to be made is the “Action Test”. Ask yourself:
“If this number drops by 10% tomorrow, do I know exactly what meeting to call or what lever to pull?”
If the answer is “I’d just continue to monitor the situation,” it’s a metric, not a KPI. Real KPIs drive immediate operational changes.
Step 3: For each Decision, Identify the Best Measurement Indicators
This includes both leading and lagging indicators, however, a common mistake is only tracking Lagging Indicators (what happened in the past). To be proactive, you must include Leading Indicators (what will happen in the future).
Lagging (The Scoreboard): Monthly Revenue, Total Defects, Quarterly Profit.
Leading (The Playbook): Machine Uptime Rate, Training Hours per Employee, Preventative Maintenance Compliance.
Example: If your “Preventative Maintenance Compliance” drops this month, you can predict that your “Machine Downtime” (a lagging indicator) will likely spike next month.
Leading indicators predict outcomes. Lagging indicators measure them. You need both, but leading metrics allow you to be proactive with your operations and influence your core business outcomes (typically lagging indicators).
To go a step further, companies can implement predictive analytics solutions that leverage leading indicators combined with machine learning to create powerful models to accurately forecast what will happen.
Step 4: Set Targets, Assign Owners, and Choose Analytics Tools
For each KPI:
Define the target (use industry benchmarks where possible—e.g., world-class OEE is ~85%, but realistic for many SMBs starts at 60–65%).
Assign one owner responsible for reporting and action.
Decide review cadence (daily huddle for production KPIs, weekly for leadership, monthly deep dive).
On Analytics tools, there are several cloud friendly tools, all available at a price-point accessible to SMBs including:
Microsoft Azure, AWS, or Google Cloud for cloud compute & data storage resources
PowerBI for data visualization
Databricks for advanced AI/ML, heavy workloads, and complex data transformations
It is also worth reviewing whether there is a reliable data source to feed the KPI you would like to build. A metric you can’t measure is worse than not tracking it — it creates false confidence. Only commit to KPIs you can collect reliably.
Ideally, across your production and supply chain processes, you will have digital systems already in place. These systems could be ERP, MES, MRP, or Procurement. If there is a digital software system in place, it has been properly implemented, and there is confidence in the accuracy of the data coming out of it, then it should be reliable data source for analytics. However, if the process relies on manual actions or isolated spreadsheets, it may be time to consider a digital upgrade before investing in analytics.
Step 5: Implement, Review, and Iterate Quarterly
Business is dynamic and your KPIs will need to adapt to changes in market conditions and business priorities. Make it a point to review and iterate on your chosen KPIs a few times per year.
Put your KPIs on one dashboard visible to the whole team. Review weekly in your operations meeting and monthly with leadership. Ask three questions:
Are we hitting targets?
What’s blocking us?
Do we still have the right KPIs?
Retire or replace any metric that no longer drives decisions. Your business evolves—your KPIs should too.
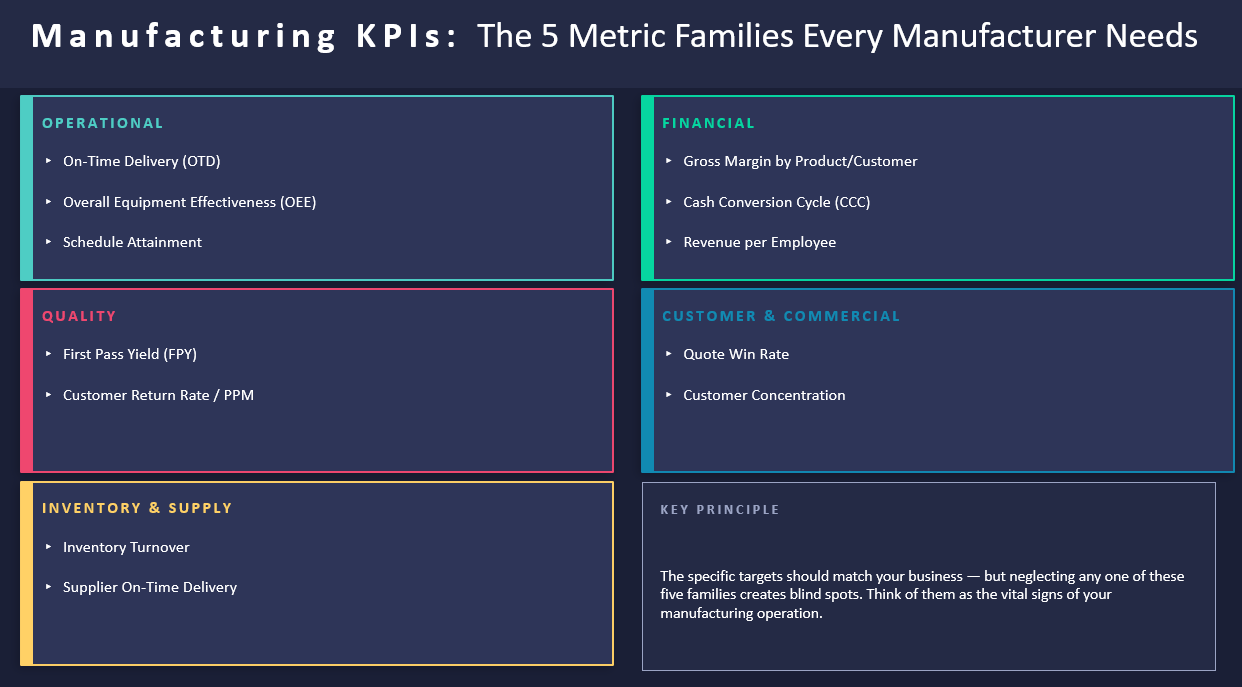
The five categories every manufacturer needs
While the specific metrics should match your business, KPIs for manufacturers almost always fall into five categories. Think of these as the five vital signs of a manufacturing operation. Neglecting any one of them creates blind spots.
Operational performance
These metrics tell you what’s happening on the floor — whether you’re producing efficiently and reliably. For most manufacturers, this is where you feel pain first, but also where you have the most control.
On-Time Delivery (OTD)
The percentage of orders shipped by the customer’s requested date. This is often the most important single metric for a job shop or make-to-order manufacturer — it drives customer satisfaction, repeat business, and your ability to charge a premium.
Orders delivered on time ÷ Total orders shipped × 100
Overall Equipment Effectiveness (OEE)
A composite metric combining availability (was the machine running?), performance (was it running at the right speed?), and quality (were parts good?). Useful if equipment is your bottleneck. Can be overkill for small shops with simple operations — don’t implement it just because you’ve heard of it.
Availability × Performance × Quality rate
Schedule Attainment
Did your production team hit the schedule they committed to? Lower tech than OEE, easier to collect, and often more actionable for a shop that doesn’t have sophisticated ERP data. Measures execution discipline.
Actual units produced ÷ Planned units × 100
Quality
Quality metrics tell you how often you get it right the first time — and how much you’re paying when you don’t. In manufacturing, poor quality has a multiplier effect: it eats capacity, strains customer relationships, and shows up in your margins long before you notice it in your P&L.
First Pass Yield (FPY)
The percentage of units that complete a process step without any rework, scrap, or rejection. One of the most powerful quality metrics because it captures hidden costs — the labor and material spent on parts that were never right. Low FPY often signals a process problem, not a people problem.
Units produced without rework ÷ Total units started × 100
Customer Return Rate / PPM
Parts returned or complaints per million units shipped (PPM). For smaller volumes, a simpler “returns as a percentage of shipments” works fine. This is the customer-facing consequence of your internal quality performance — track it separately from internal scrap so you see both dimensions.
Returned units ÷ Total shipped × 1,000,000
Inventory & Supply Chain
Inventory Turnover
Supplier on-time delivery
Financial performance
Financial KPIs aren’t just for accountants. The right ones give operators a direct line of sight to the economic consequences of daily decisions — and help owners see problems before they hit the bank account.
Gross Margin by Product / Customer
Revenue minus direct costs, broken down by product line or customer. Many SMB manufacturers know their overall margin but not where it comes from. This metric frequently reveals that a handful of products or customers are subsidizing unprofitable ones — a finding that changes how you quote, what you pursue, and who you spend time on.
(Revenue − COGS) ÷ Revenue × 100
Cash Conversion Cycle
How many days pass between paying for raw materials and collecting from customers. Even profitable manufacturers can run into cash problems if this number is too high. It combines days inventory outstanding, days sales outstanding, and days payable outstanding into a single view of working capital health.
DIO + DSO − DPO
Revenue per Employee
A blunt but useful measure of labor productivity. Compare it to industry benchmarks and track it over time. Rising revenue per employee generally signals improving efficiency; stagnation alongside wage growth signals a margin problem developing below the surface.
Total revenue ÷ Full-time equivalent headcount
Customer and commercial
Growth-oriented KPIs matter even for manufacturers who primarily serve existing accounts. Your best customers grow, shrink, or leave — and the leading indicators of those changes are visible in the data long before revenue moves.
Quote Win Rate
The percentage of quotes that convert to orders. A falling win rate is often the earliest signal of a pricing or competitive problem. Breaking it down by customer type, product category, or salesperson often reveals patterns that aggregate numbers hide.
Orders received ÷ Quotes submitted × 100
Customer Concentration
What percentage of revenue comes from your top three customers? High concentration (above 50%) is a risk that belongs on any SMB manufacturer’s dashboard. It doesn’t need to be reviewed weekly, but it should be visible — and if it’s growing, it should trigger a conversation about business development priorities.
Top 3 customer revenue ÷ Total revenue × 100
Avoid these traps
Knowing what to track is half the battle. Knowing what not to do with your metrics is the other half.
Don’t track metrics you can’t influence. If your team has no control over raw material prices, tracking commodity cost variance might be interesting but it isn’t a KPI — it’s information. KPIs should motivate action, not just observation.
Don’t let KPIs become targets in a dysfunctional way. Goodhart’s Law is real in manufacturing: when a measure becomes a target, it ceases to be a good measure. If you tell your team their bonus depends on on-time delivery, don’t be surprised if quality suffers. Balance your metrics across dimensions so optimizing one doesn’t quietly destroy another.
Don’t review KPIs without context. A 94% on-time delivery rate means something different if last month it was 98% versus if it was 88%. Always show trends, not just snapshots. And when a number moves, spend the first five minutes of the conversation asking why before jumping to solutions.
Don’t confuse data availability with relevance. Modern ERP and MES systems can generate hundreds of metrics automatically. That’s a trap. The question isn’t “can we measure this?” but “does measuring this help us make better decisions?”
A practical starting point
If you’re starting from scratch or rebuilding your measurement system, here’s a shortlist that works for most SMB manufacturers. Pick from this, adapt it to your situation, and commit to reviewing it consistently for 90 days before adding anything else.
On-Time Delivery — reviewed weekly
First Pass Yield — reviewed weekly
Schedule Attainment — reviewed weekly
Gross Margin by product line — reviewed monthly
Days Sales Outstanding — reviewed monthly
Quote Win Rate — reviewed monthly
Customer Return Rate — reviewed monthly
Revenue per Employee — reviewed quarterly
The best KPI system is the one your team actually uses to run the business — not the one that looks most impressive on a slide. Start narrow, build the habit of review, and add complexity only when you’ve outgrown what you have.
Ready to put your data to work? That's where Lasso comes in.
Knowing which KPIs to track is one thing. Having the infrastructure to collect, surface, and act on that data is another. For most SMB manufacturers, the gap between “we should be measuring this” and “we actually are” comes down to a lack of time, technical resources, or a clear path forward.
Lasso is a data strategy and implementation consultancy that works specifically with manufacturers to close that gap. The work starts with strategy — helping you define what to measure, why it matters, and how it connects to the decisions your team makes every day. From there, Lasso handles the technical implementation: building out cloud data infrastructure on Microsoft Azure, connecting your ERP, MES, and operational systems, and delivering the dashboards your team actually needs to run the business.
Data Strategy
Lasso works with your leadership team to define the metrics that matter, align them to business goals, and build a measurement roadmap — before a single line of code is written.
Cloud Implementation on Microsoft Azure
From data pipelines to warehousing to security and governance, Lasso designs and deploys scalable Azure infrastructure that grows with your operation — without requiring an in-house data engineering team.
End-User Dashboards
Purpose-built dashboards for the people who run the floor, manage the books, and serve the customers. Clean, actionable, and connected to your live data — not a generic template.
Managed Services
Once your system is live, Lasso stays in the picture. Ongoing maintenance, monitoring, and support means your data infrastructure stays reliable — and you have a partner to call when something needs to change.
Whether you’re starting from a blank slate or trying to make sense of data that’s already scattered across systems, Lasso can help you build something your team will actually use — and keep it running.