
Case Study
Real-Time Manufacturing Dashboards for Plant Floor Visibility
- Home
- /
- Case Studies
- /
- Case Study: Real-Time Manufacturing Dashboards for Plant Floor Visibility
Client Overview
A mid-sized discrete manufacturing plant was struggling with limited real-time visibility into shop floor performance. Plant supervisors relied on end-of-shift reports, while operators tracked production using whiteboards and spreadsheets. By the time issues were identified—equipment downtime, quality drift, or missed throughput targets—the impact had already occurred.
Problem
Plant floor teams faced fragmented visibility into operations, leading to inefficiencies and reactive maintenance. Key issues included:
Delayed KPI Tracking: Supervisors and operators checked metrics like production rate and defect rates only at shift ends, missing real-time fluctuations that caused an average of 12% daily output variance.
Inconsistent & Suboptimal Equipment Effectiveness: Calculations for equipment effectiveness varied across production lines while micro-stops, unplanned downtime, and quality losses dragged down output.
Ineffective Issue Detection: Operators spotted problems like machine jams or quality deviations too late, often after batches were compromised, resulting in excessive scrap costs and overtime due to rushed fixes.
These challenges stemmed from siloed data sources—machine sensors, quality logs, and ERP systems—preventing proactive interventions and contributing to a 10% drop in on-time deliveries.
Leadership wanted a way to:
Give operators immediate feedback on performance
Enable supervisors & operators to spot issues in real time
Improve overall equipment effectiveness (OEE)
Reduce downtime and unplanned stoppages
The solution needed to be simple, visual, and usable directly on the plant floor.
The Solution: Tiered Real-time Dashboards
Lasso built and implemented customized real-time dashboards tailored for plant floor supervisors and operators using a cloud-based modern analytics stack. The implementation emphasized accessibility, with dashboards displayed on large shop-floor display screens and tablets for on-the-go use.
Solution Architecture: The solution looked at data sources, requirements to process this source data into the required format, and how to visualize these metrics to shop floor personnel.
Data Sources: PLC signals (cycle time, run status, fault codes), MES events (job start/stop, changeovers), and Quality inspection results.
Data Processing: Streaming ingestion with sub-minute latency, Business rules applied to calculate desired KPIs (Availability, Performance, Quality, OEE, etc.) and Threshold-based alerts for abnormal conditions
Visualization Layer: Large screen displays on the shop floor for operators with supervisor dashboards accessible via tablets and desktops.
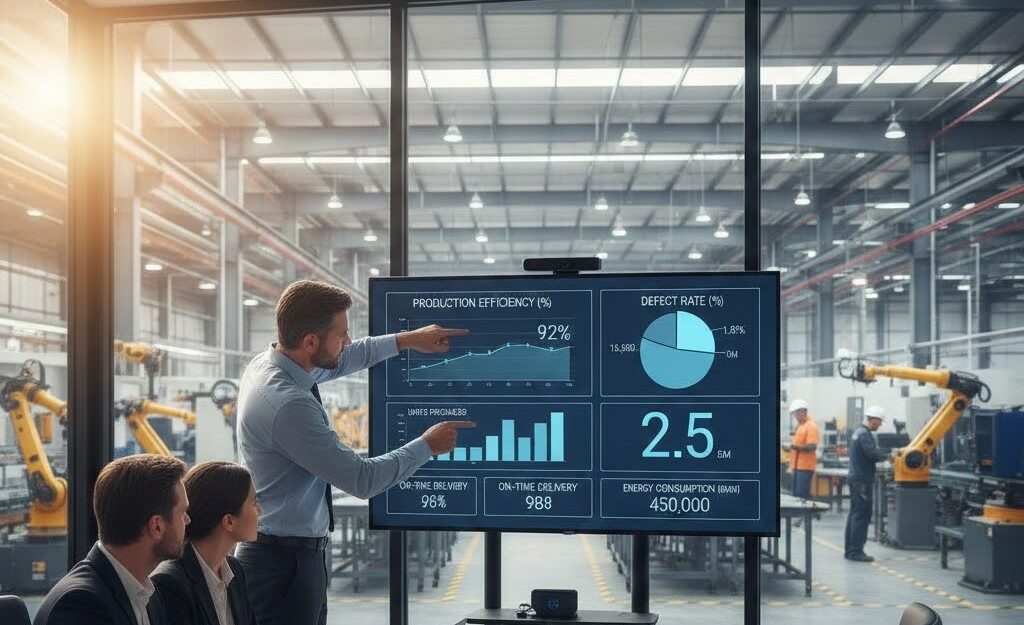
Real-Time KPI Monitoring: Dashboards integrated IoT sensors and MES data to visualize core KPIs such as units produced per hour, cycle time, downtime duration, and defect rates. Visual elements like gauges and trend charts updated every few seconds, allowing operators to track production against targets instantly.
OEE Breakdown and Analysis: A dedicated OEE dashboard dissected the metric into availability, performance, and quality pillars, providing breakdowns for individual machines. This included historical comparisons to spot trends, such as recurring speed losses or minor stops, enabling supervisors to drill down into root causes like equipment wear.
Issue Detection and Alerts: Data driven anomaly detection flagged issues in real-time, such as deviations in machine vibrations or quality metrics exceeding thresholds.
User-Centric Design and Rollout: Dashboards followed best practices for simplicity—limiting to 6-8 KPIs per view, using color-coded indicators (green for optimal, red for alerts), and incorporating role-specific filters (e.g., line-level for operators, plant-wide for supervisors).
Outcomes
The real-time dashboards revolutionized the company’s operations, shifting from reactive to proactive factory floor management:
Improved KPI Tracking and Responsiveness: Real-time visibility reduced output variance, with operators addressing bottlenecks faster, boosting daily production.
Enhanced Equipment Effectiveness: OEE climbed, driven by a drop in unplanned downtime and fewer micro-stops, as early alerts prevented escalations.
Superior Issue Detection: Scrap costs fell, and overtime decreased, as predictive alerts minimized disruptions. Supervisors reclaimed a significant amount of their time for value-added tasks like process optimization.
Broader Business Impact: On-time delivery rates improved to 95%, enhancing customer satisfaction and securing two new contracts worth $5M. Employee morale rose, with feedback highlighting the dashboards’ role in making the floor “smarter and safer.”

Book A Free 30-Minute Manufacturing Data Assessment
Identify data gaps affecting productivity, waste, and downtime
Develop a clear, actionable plan with prioritized opportunities and recommendations